Aligning design with business strategy
10% more weekly active users
ROLE
Product designer
TIME LINE
Jan - May 2024. (5 months)
CORE RESPONSABILITIES
User research, product strategy, product/UI design.
Some context
Innovamat is an edTech company that brings the science of math teaching to the classroom in an easy-to-use product. It’s purpose is to unleash everyone's potential through education.
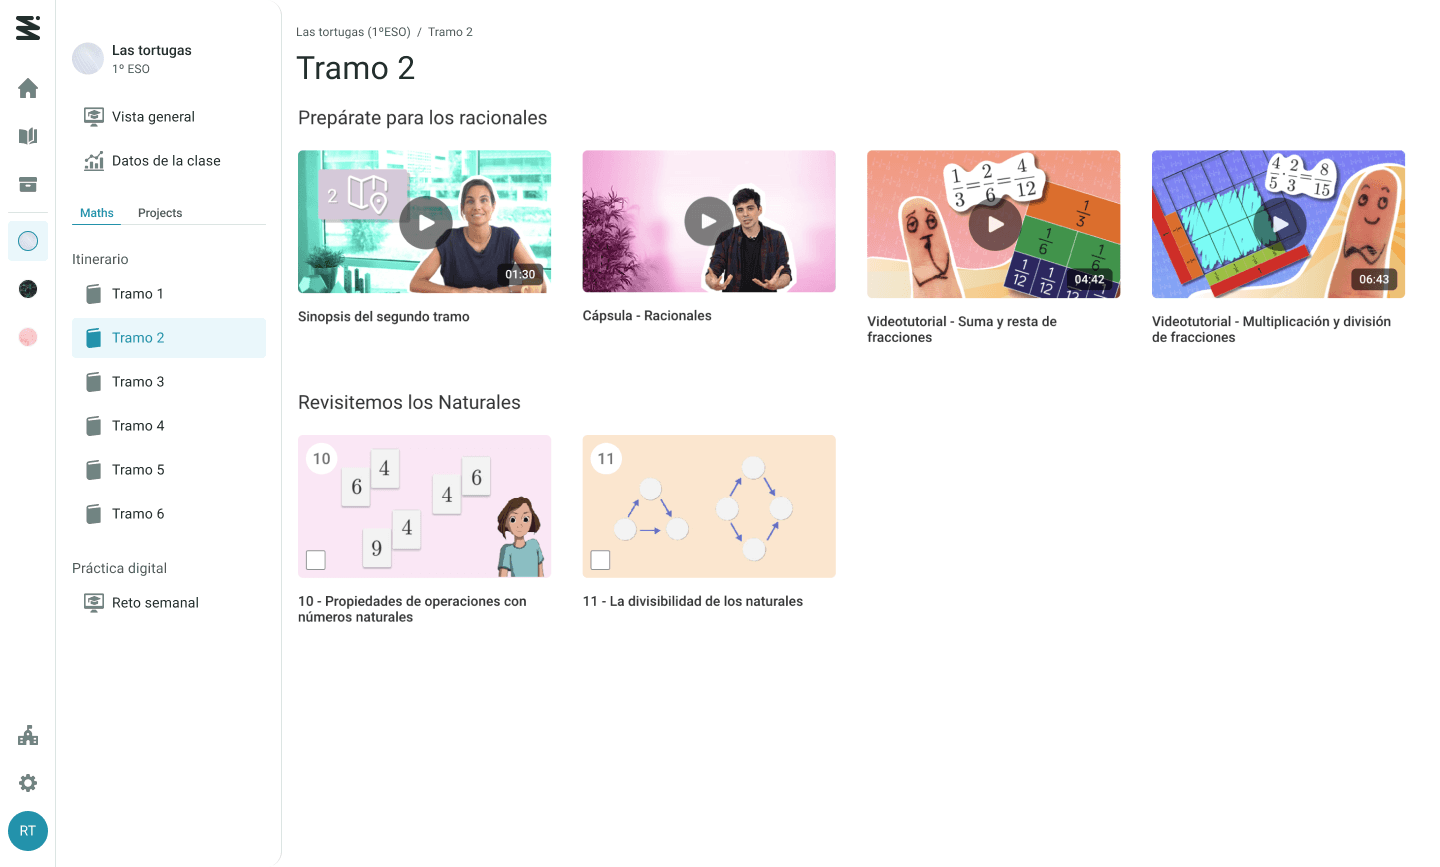
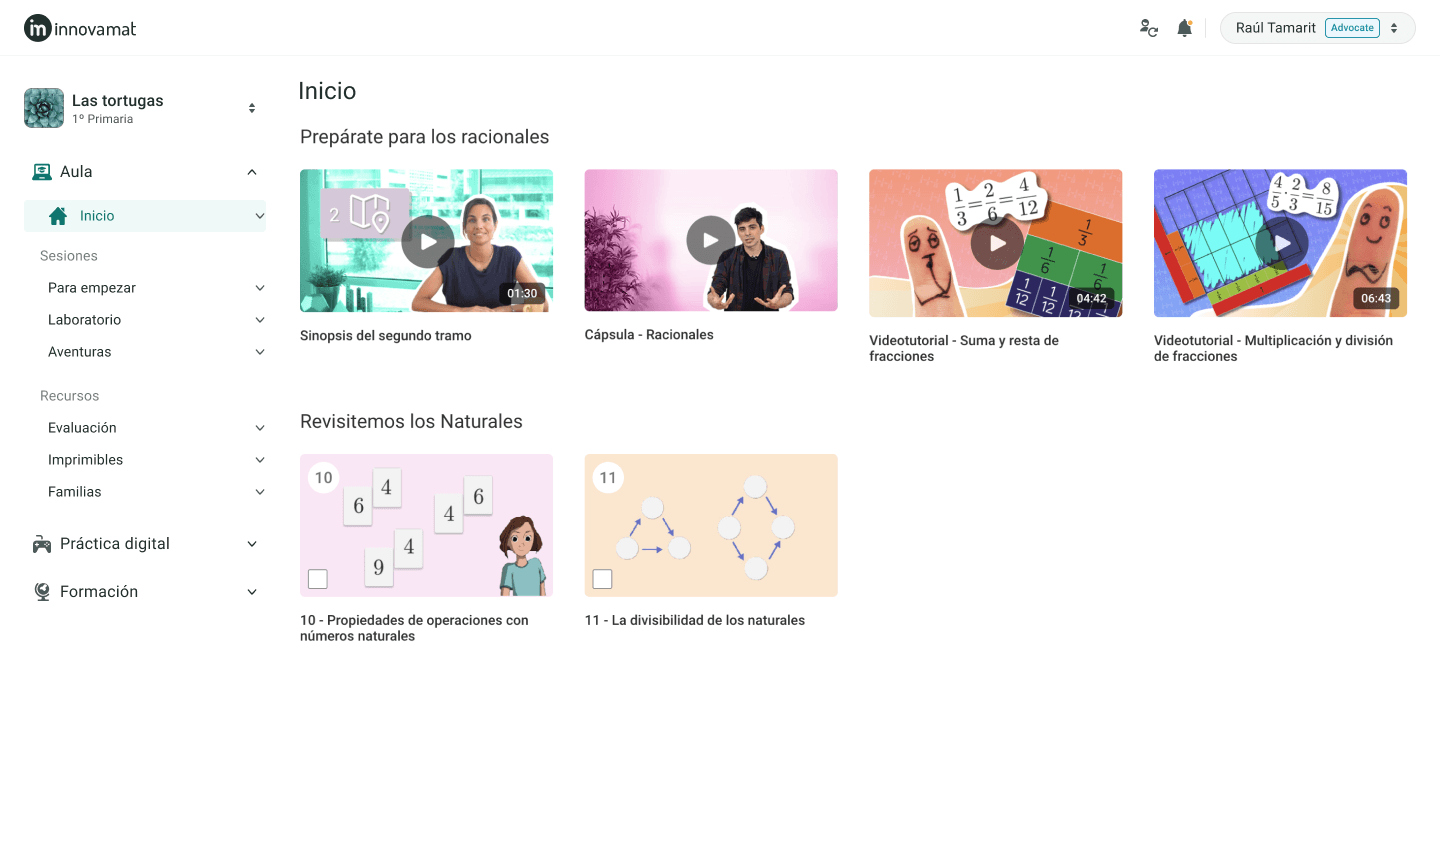
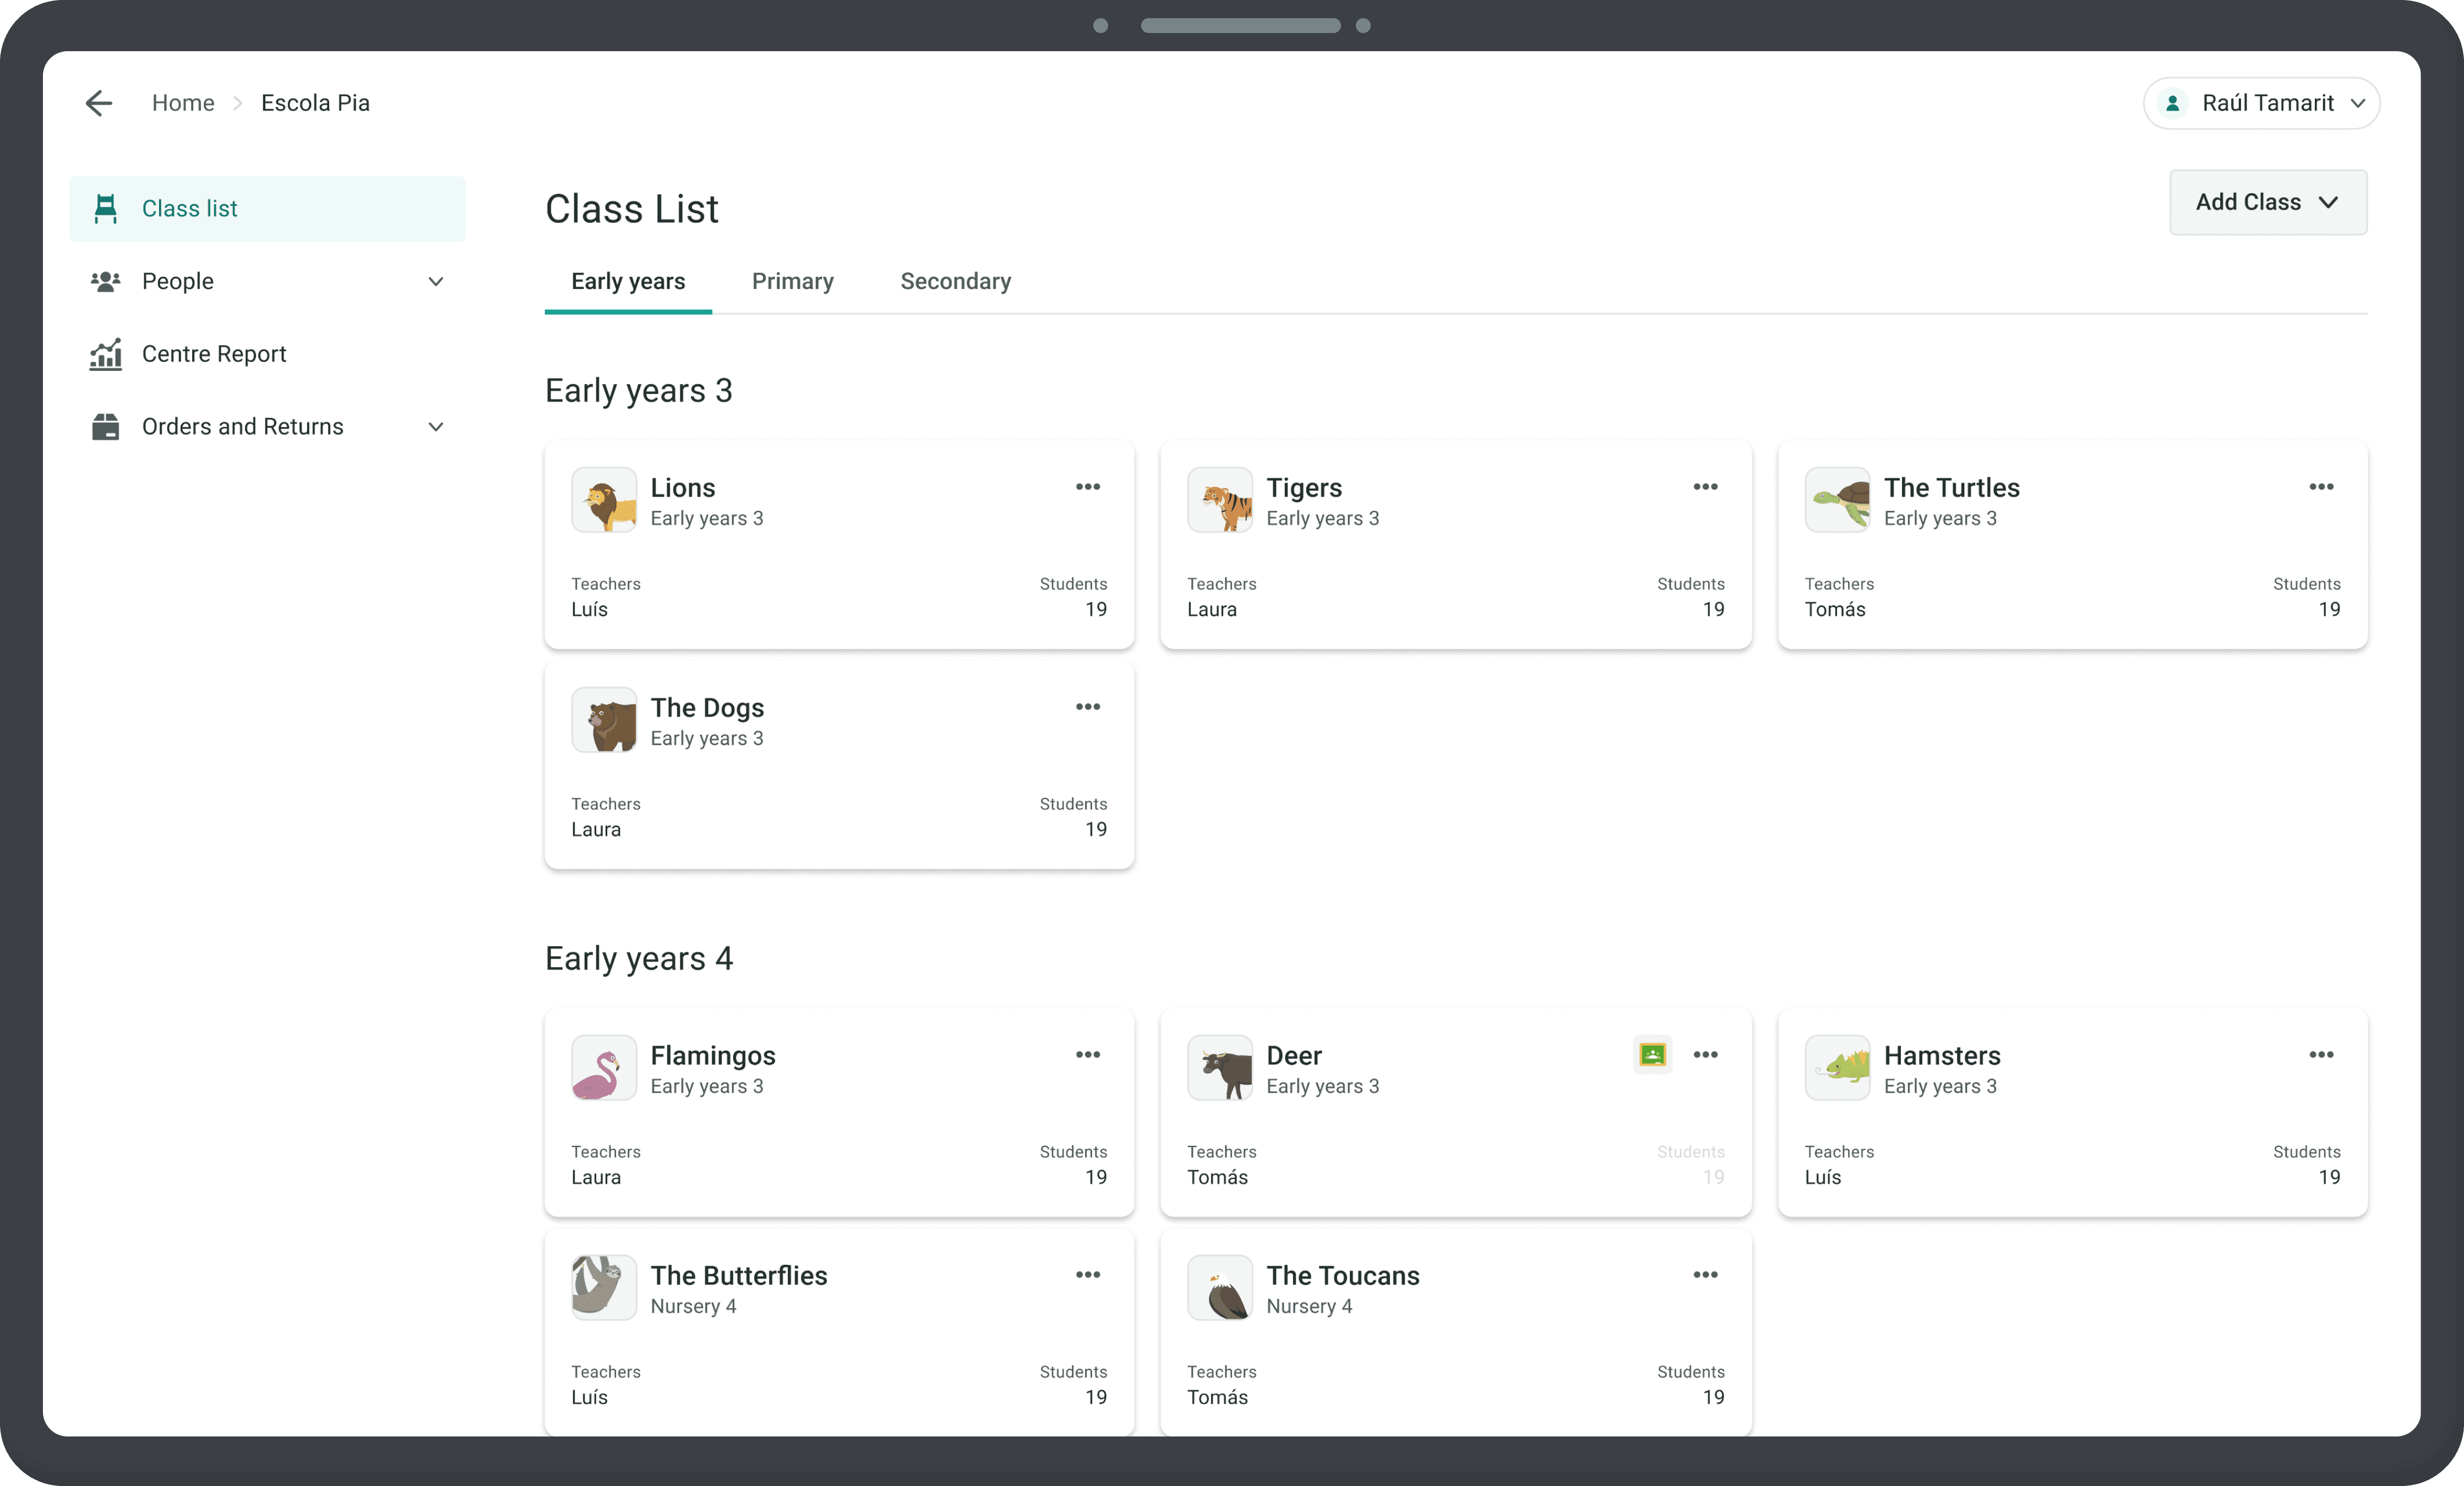
The latest changes in the company strategy, resulted in the need of a new information architecture of the product “Classroom manager” in order to fit the new business vision and the market demands.
Learn more about innovamat here.
What were the business problems?
Objectives and success definition
Align the information architecture with the business strategy.
metrics:
Churn
Improve onboarding and setup experience for a better activation ratio and times
metrics:
WAT & WAC (weekly active teachers and classes)
nº incidences related to the set up of the classroom manager
Activation time (for schools)
Ease access to the needed resources
metrics:
Median time to reach a desired resource (in s)
Discovery: Interviews and insights to understand the context
Interviewing user and different stakeholders, allowed us to find out opportunities where the information architecture could help.
Teachers
The information architecture could help improve the set up. Our product should explain itself that you have to create your class, and add your students once you reach the classroom manager.
School admins
Year upgrade experience for existing accounts.
Customer success
The metrics of the classroom manager could help account managers to better understand if a school is in churn risk and take actions to prevent it.


Ideation: Information architecture definition
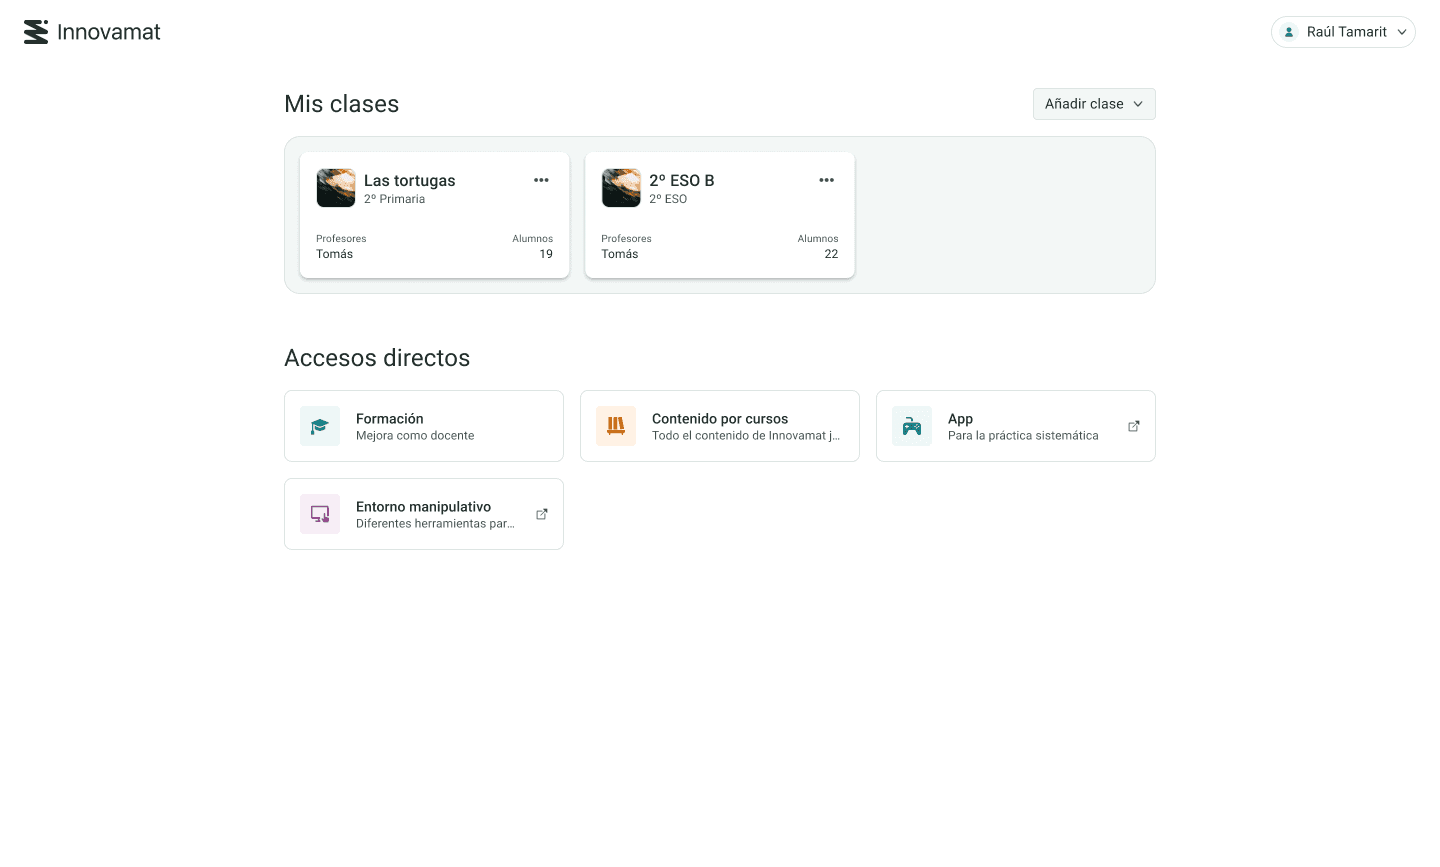
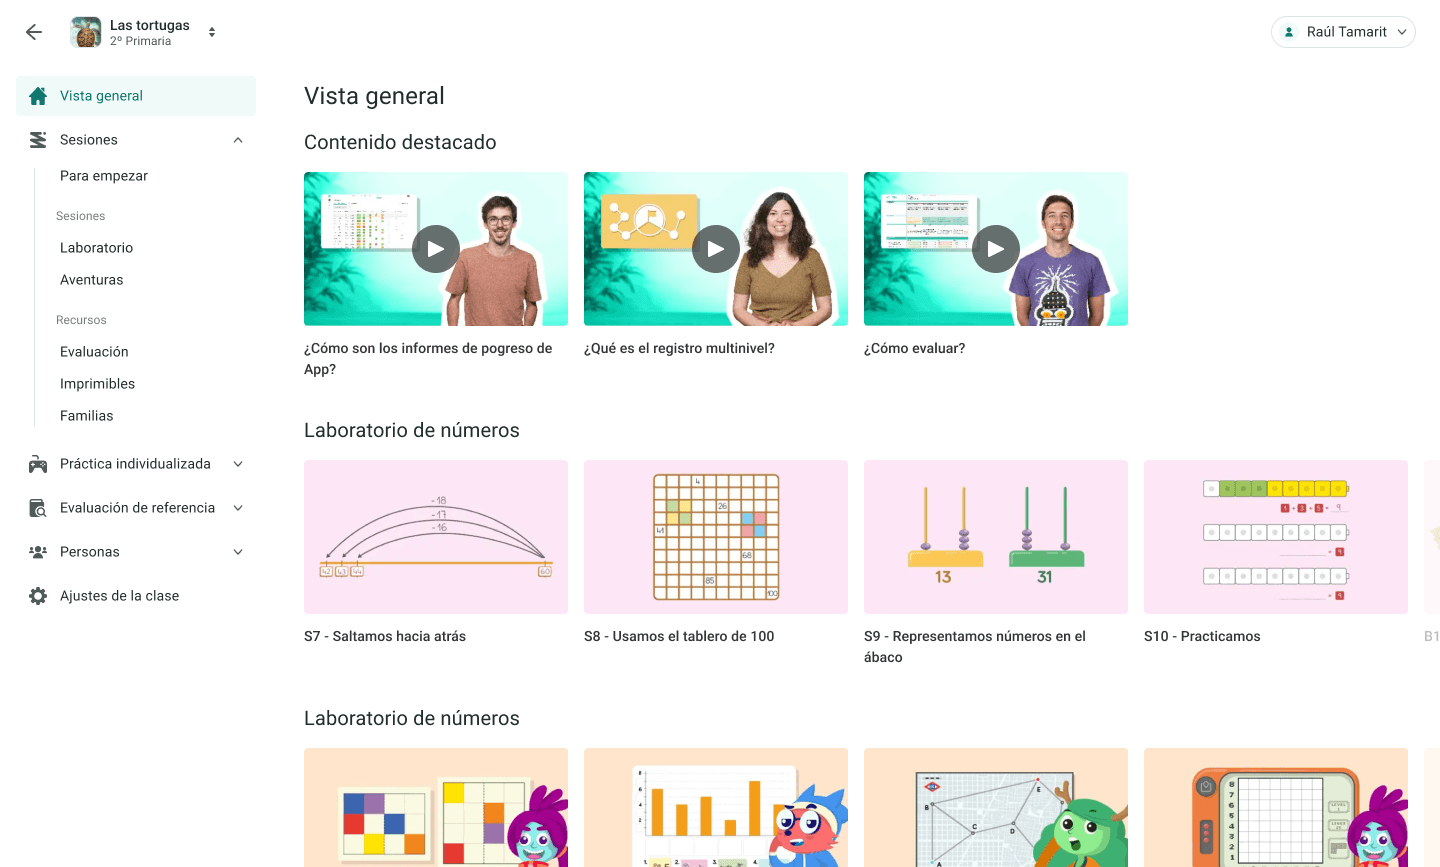
Building the information architecture for the different roles based on the business objectives and insights from the interviews.
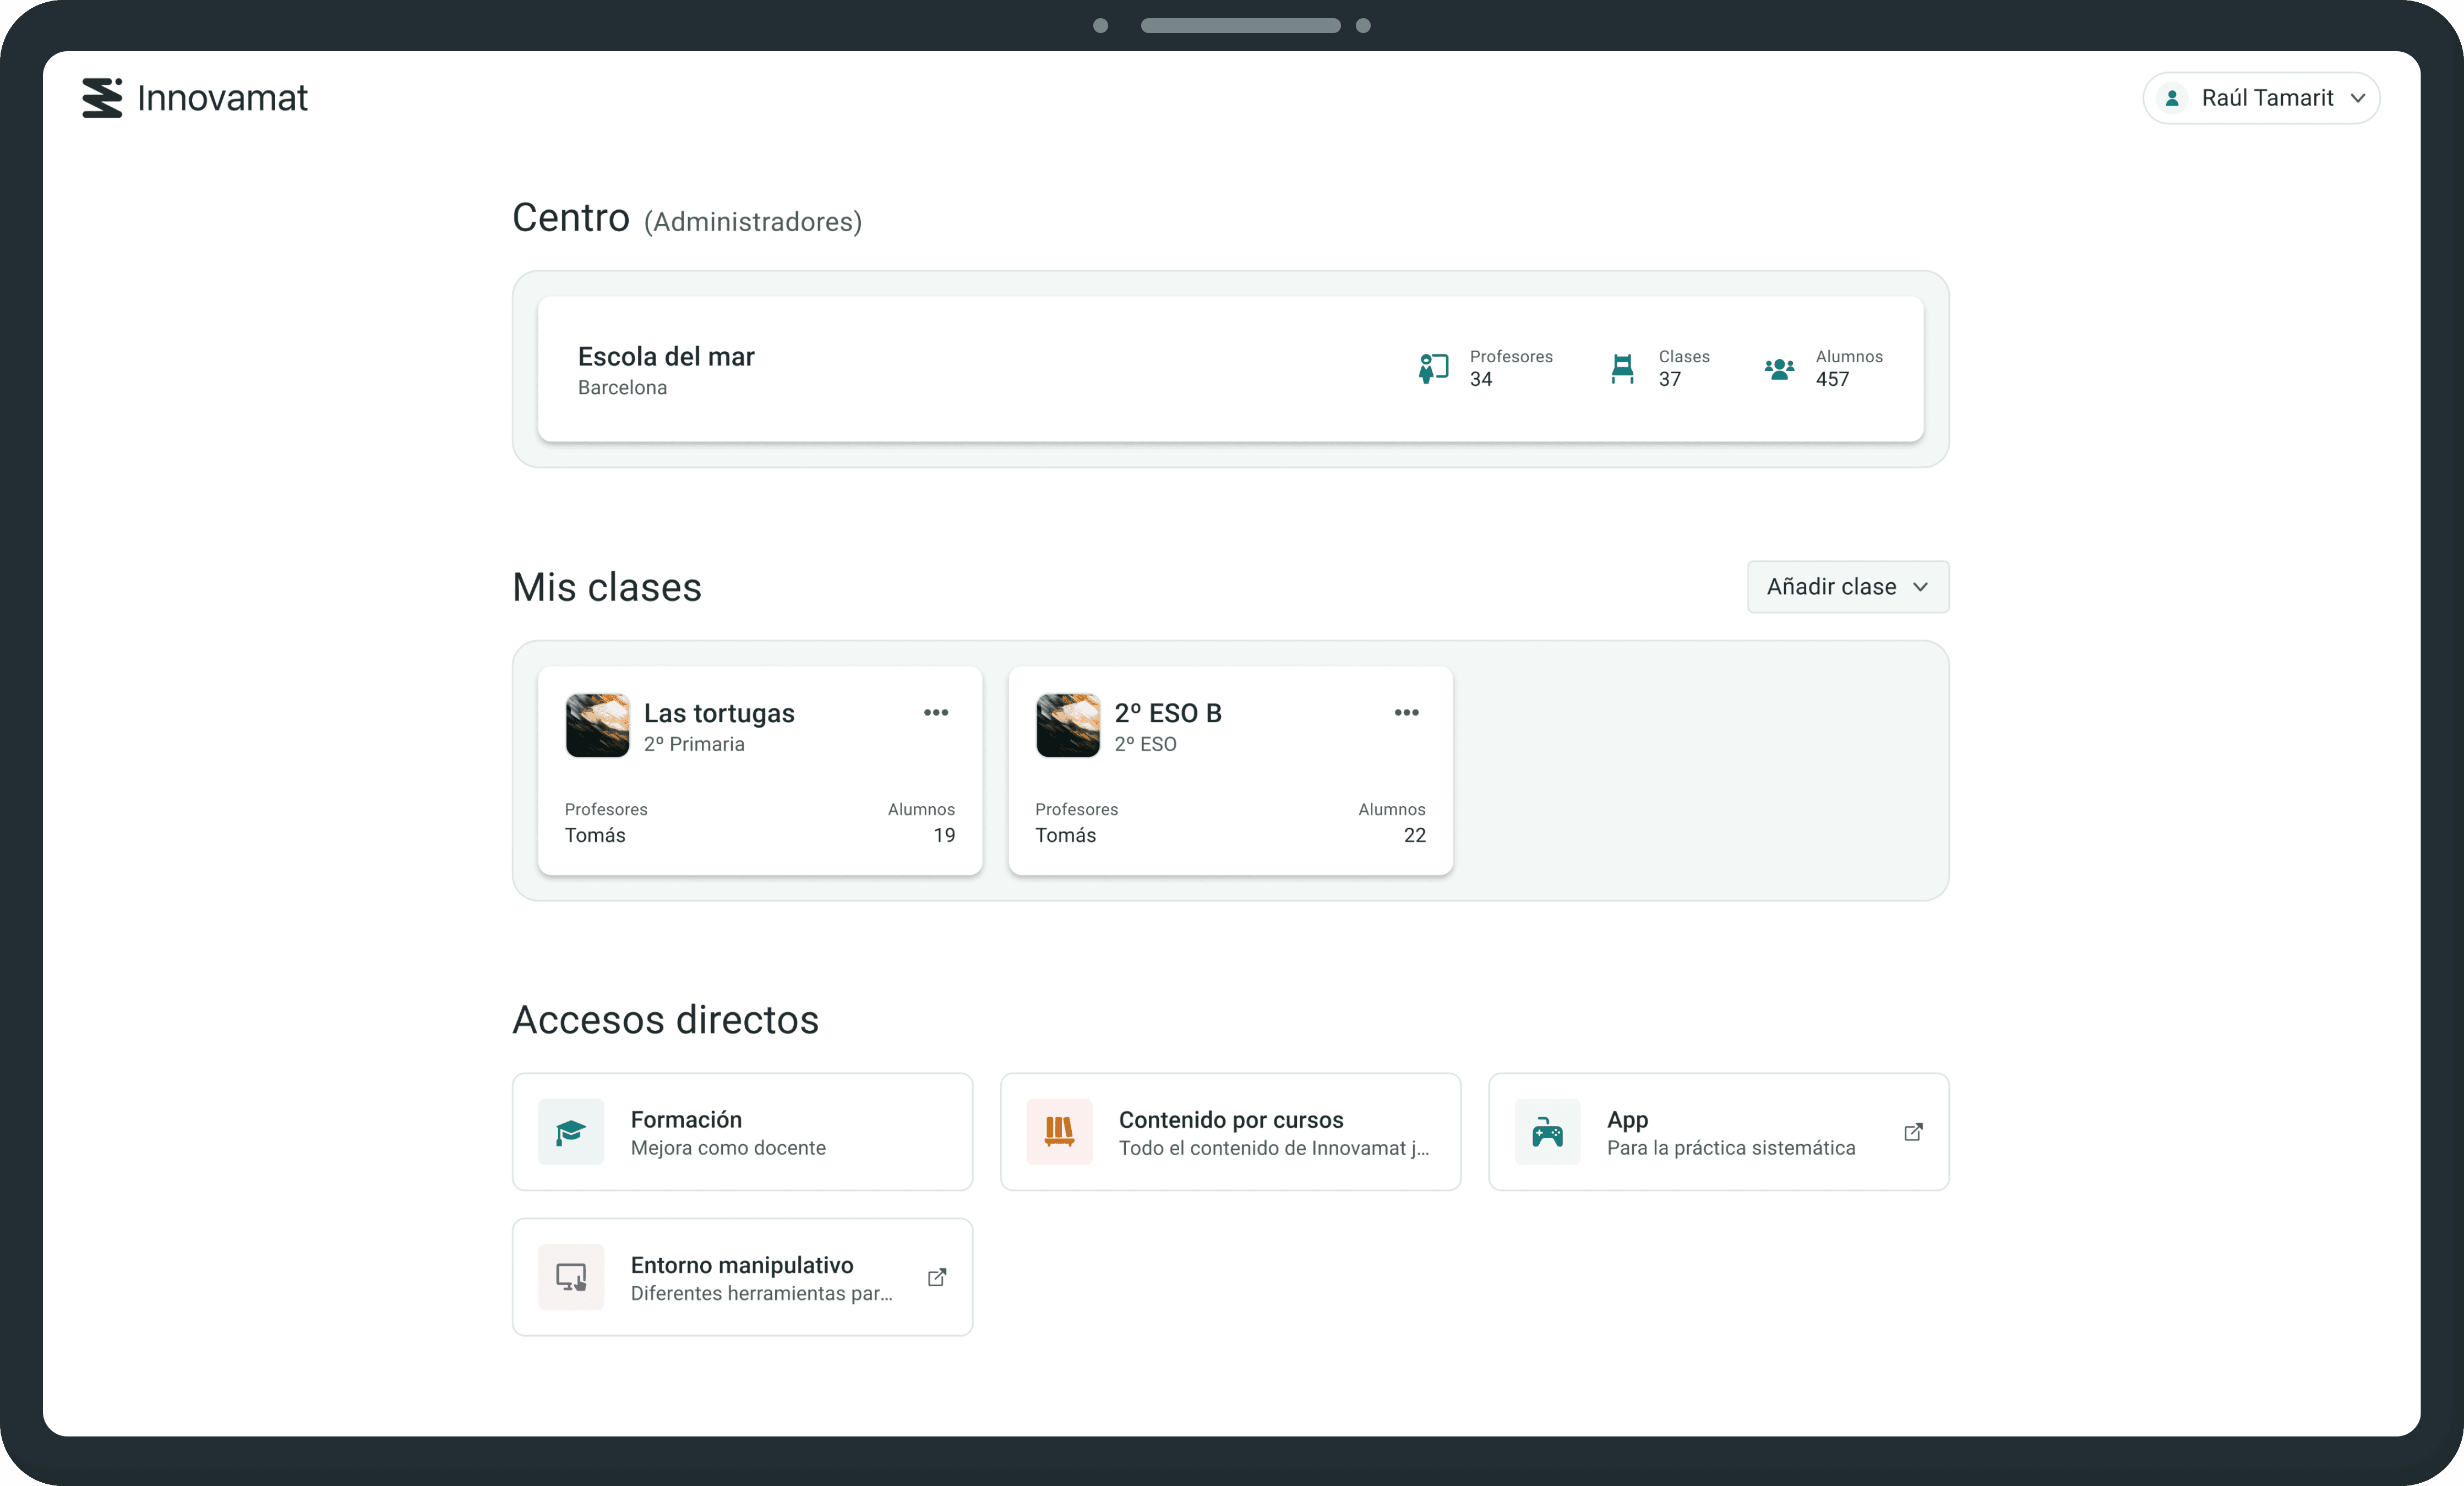
Class as the center of the experience
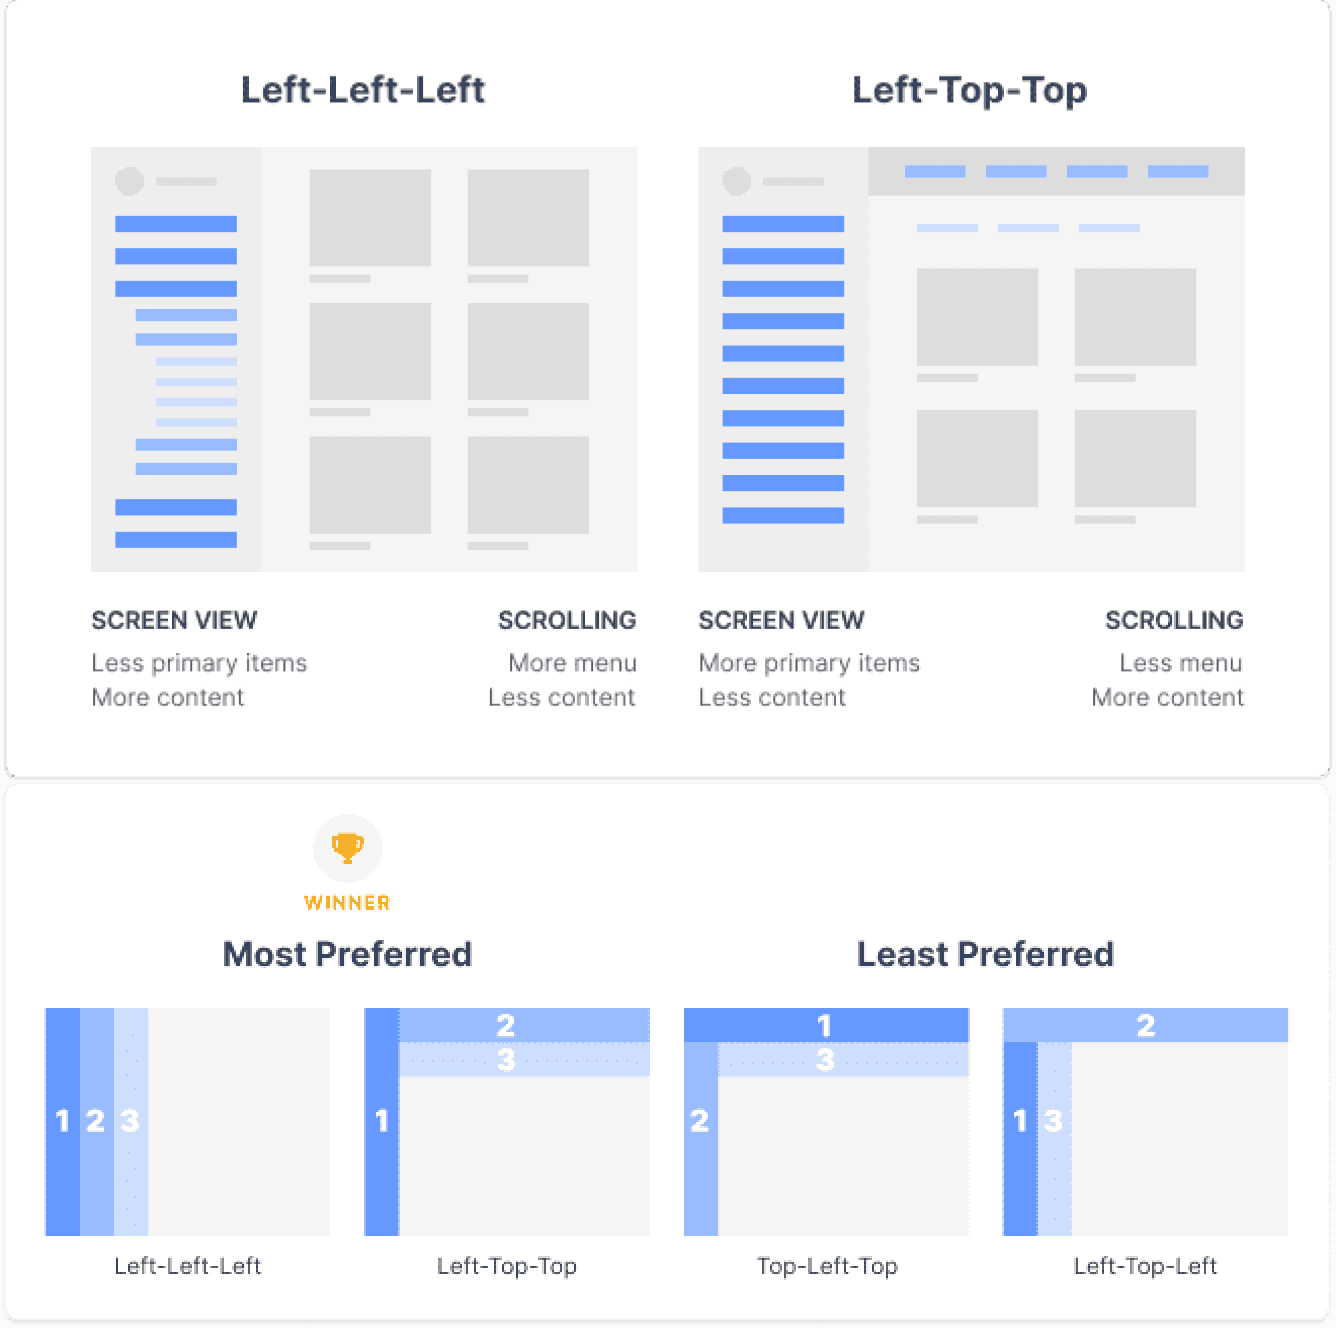
Navigation exploration
We were exploring with the stakeholders a navigation that could fit us.
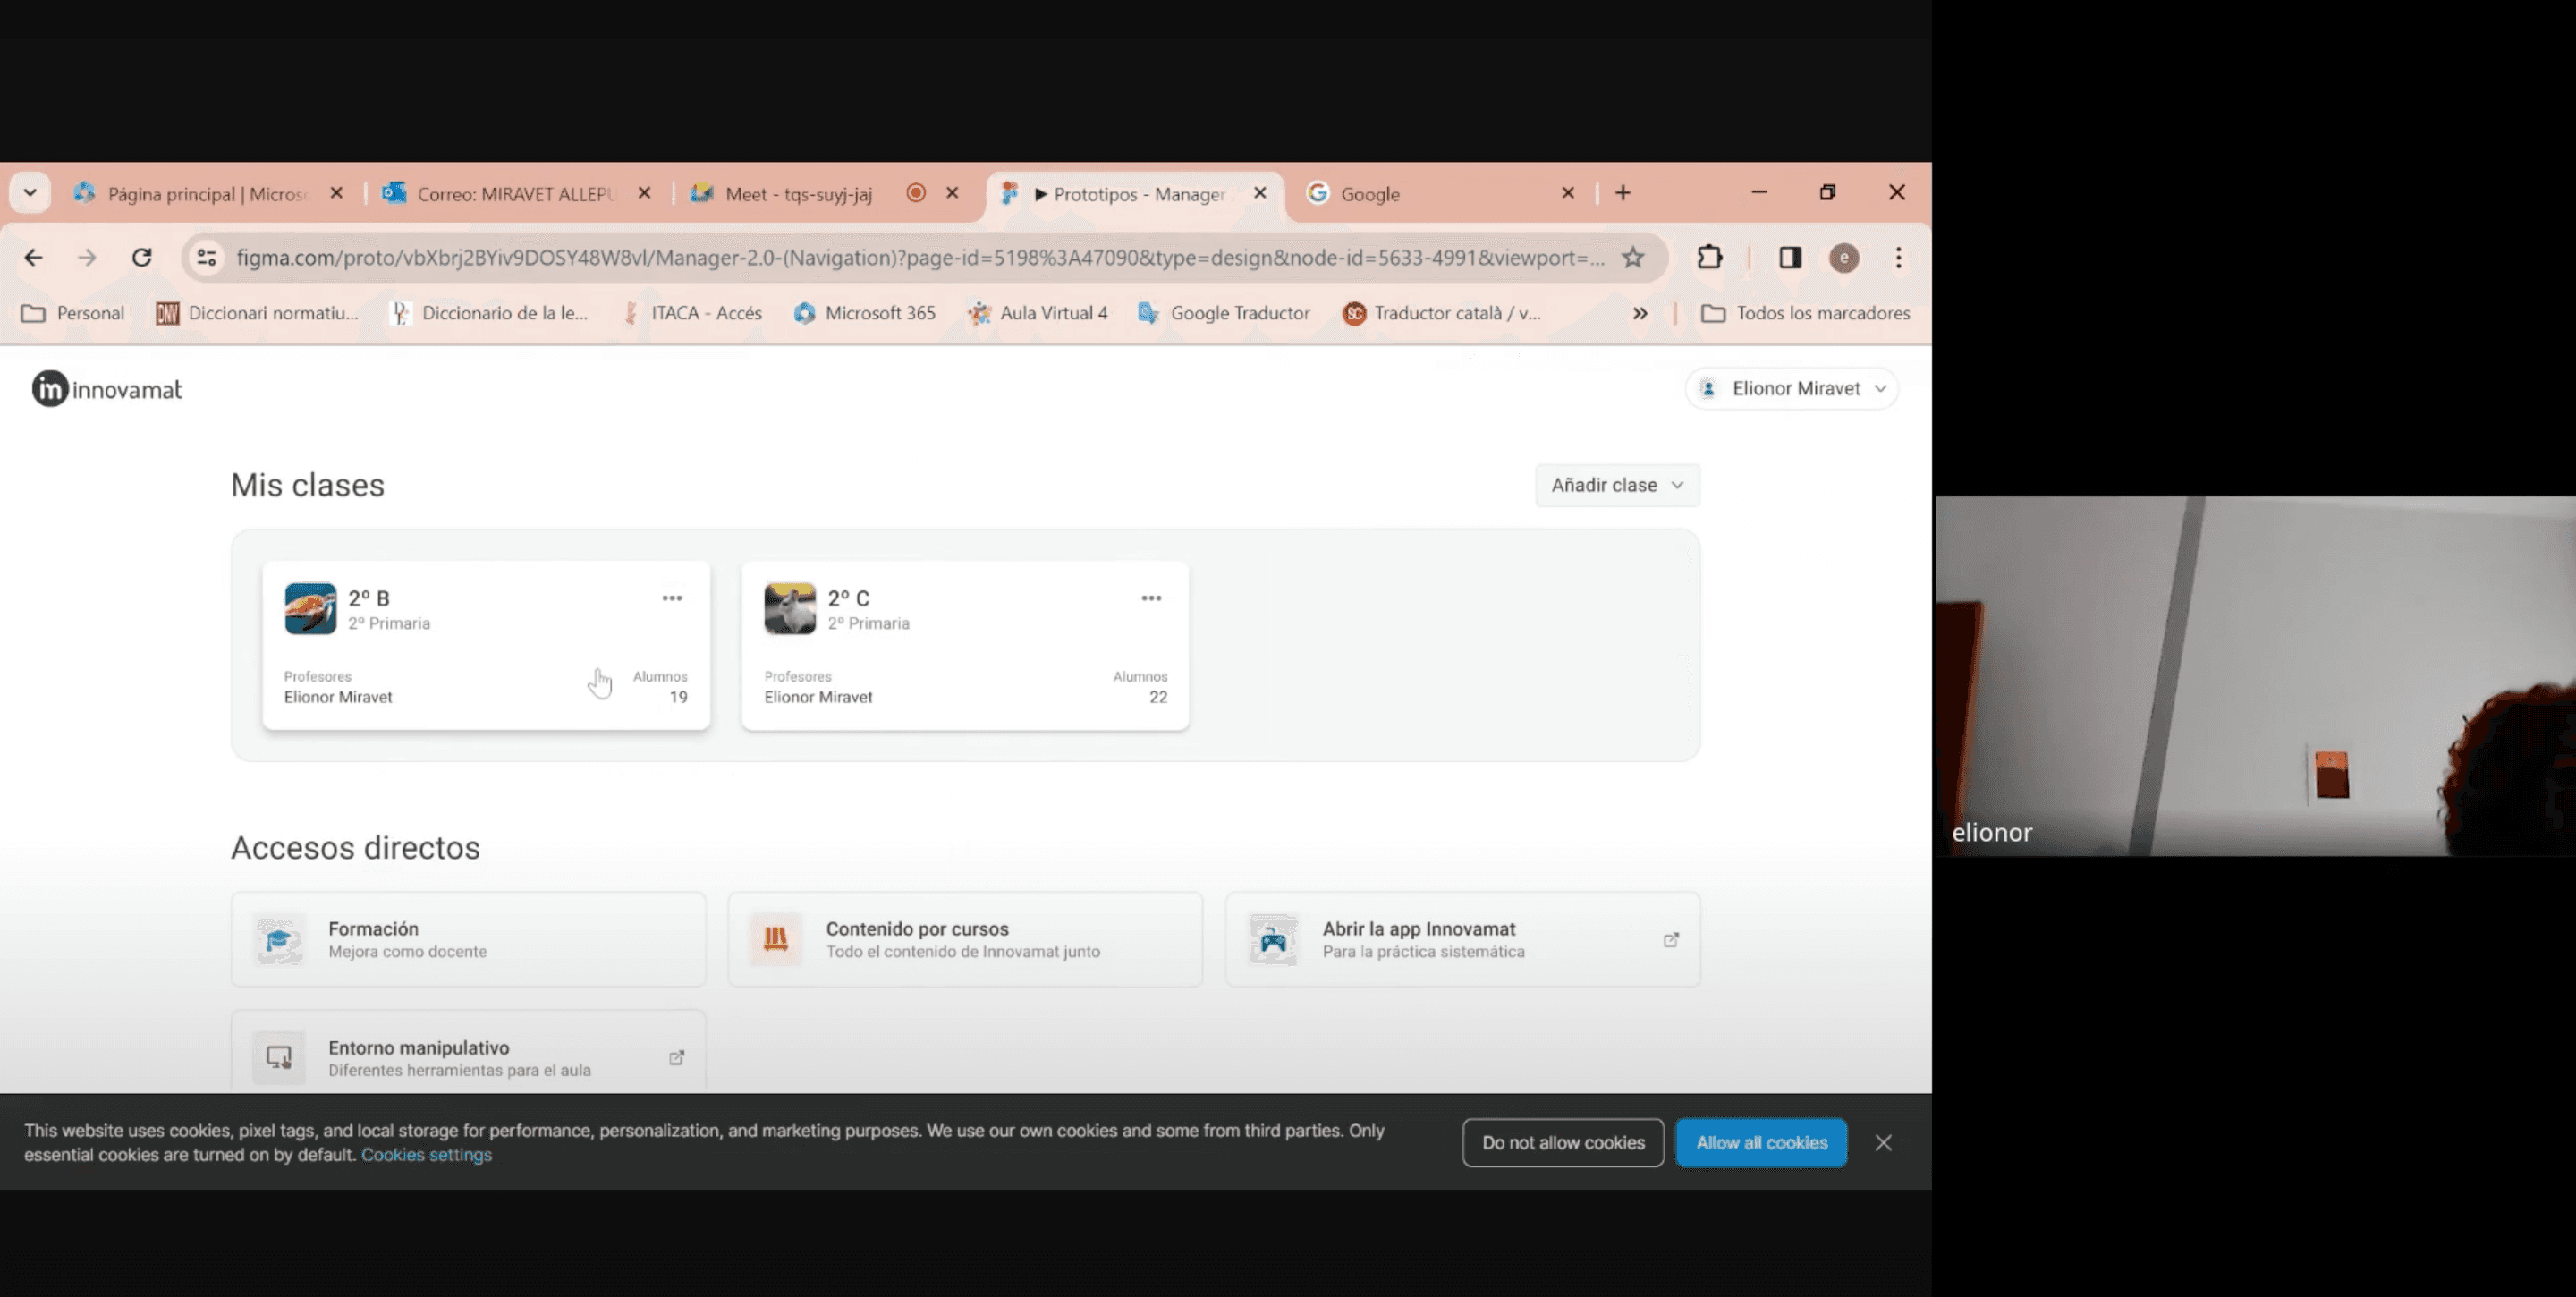
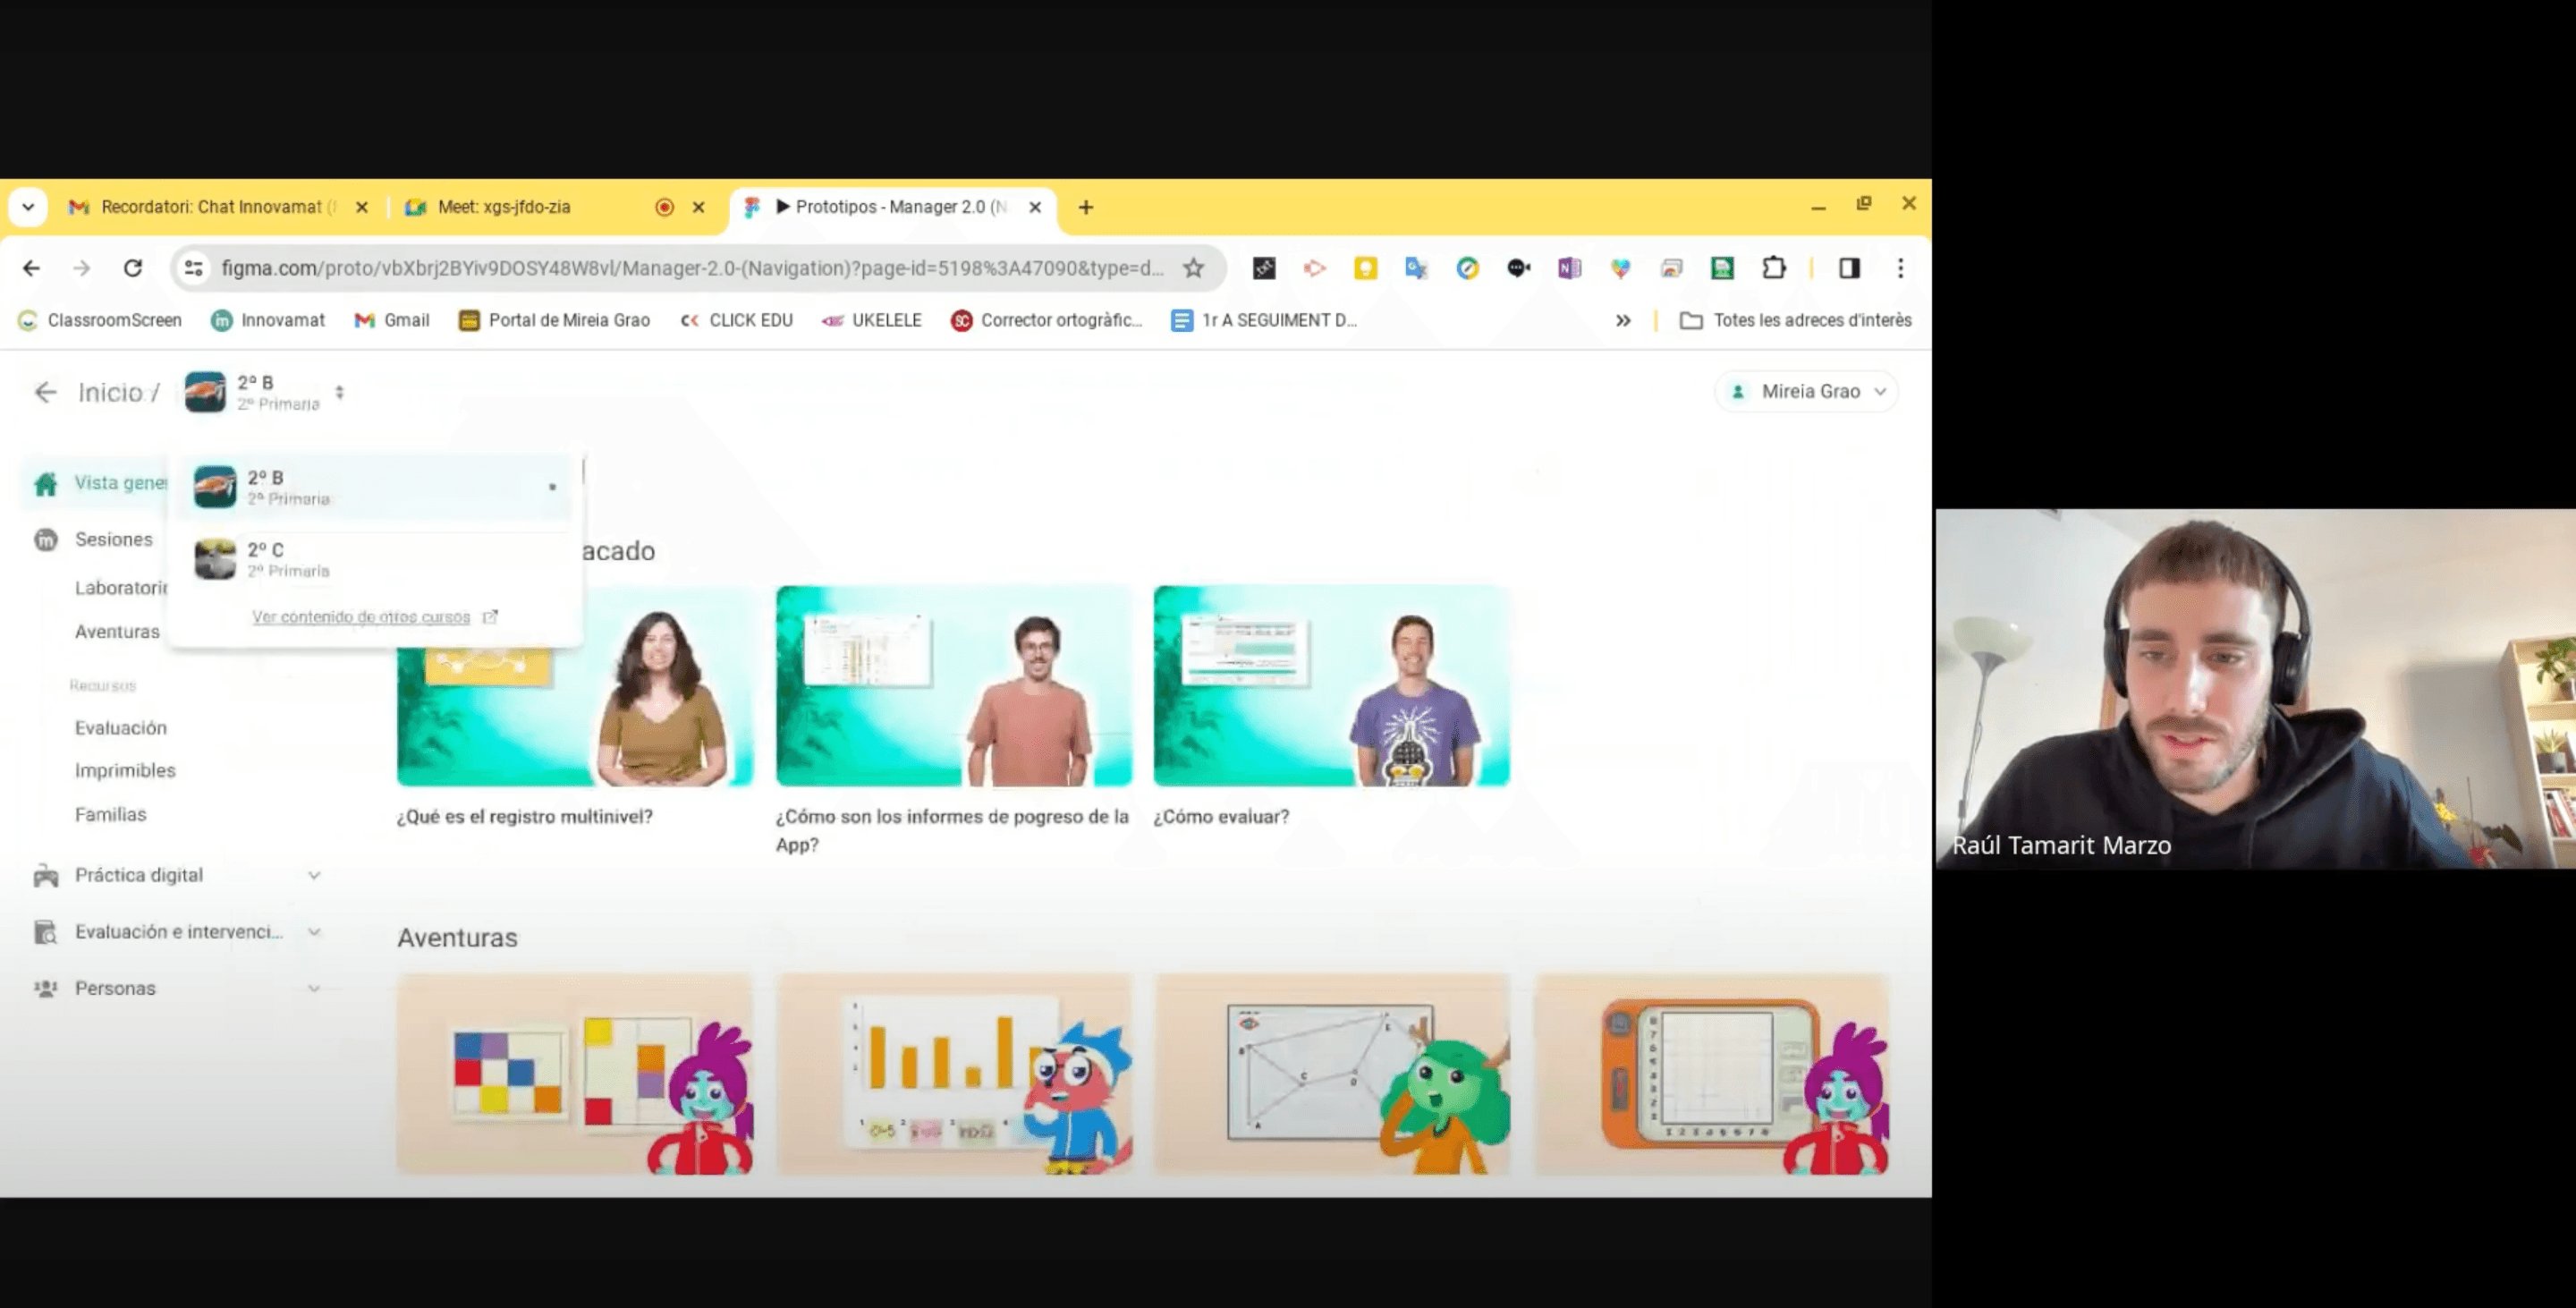
Prototyping and user testing
In order to validate and iterate our decisions. The team conducted different user testings with a functional prototype made in Figma.
Validations
80%
On task achievement when finding different elements through the navigation.
100%
Of the users understood the mental model of coming in and out of a class.
85%
On task achievement in school management tasks.
Iterations
Copys
Copys such as the "content per course" or the "weekly reports" were changed based on user feedback.
Behaviour
When opening a class, users expected to see students list radder than teachers list.
Visuals
School card had just a shadow. It was surrounded by a surface to made it more clickable.
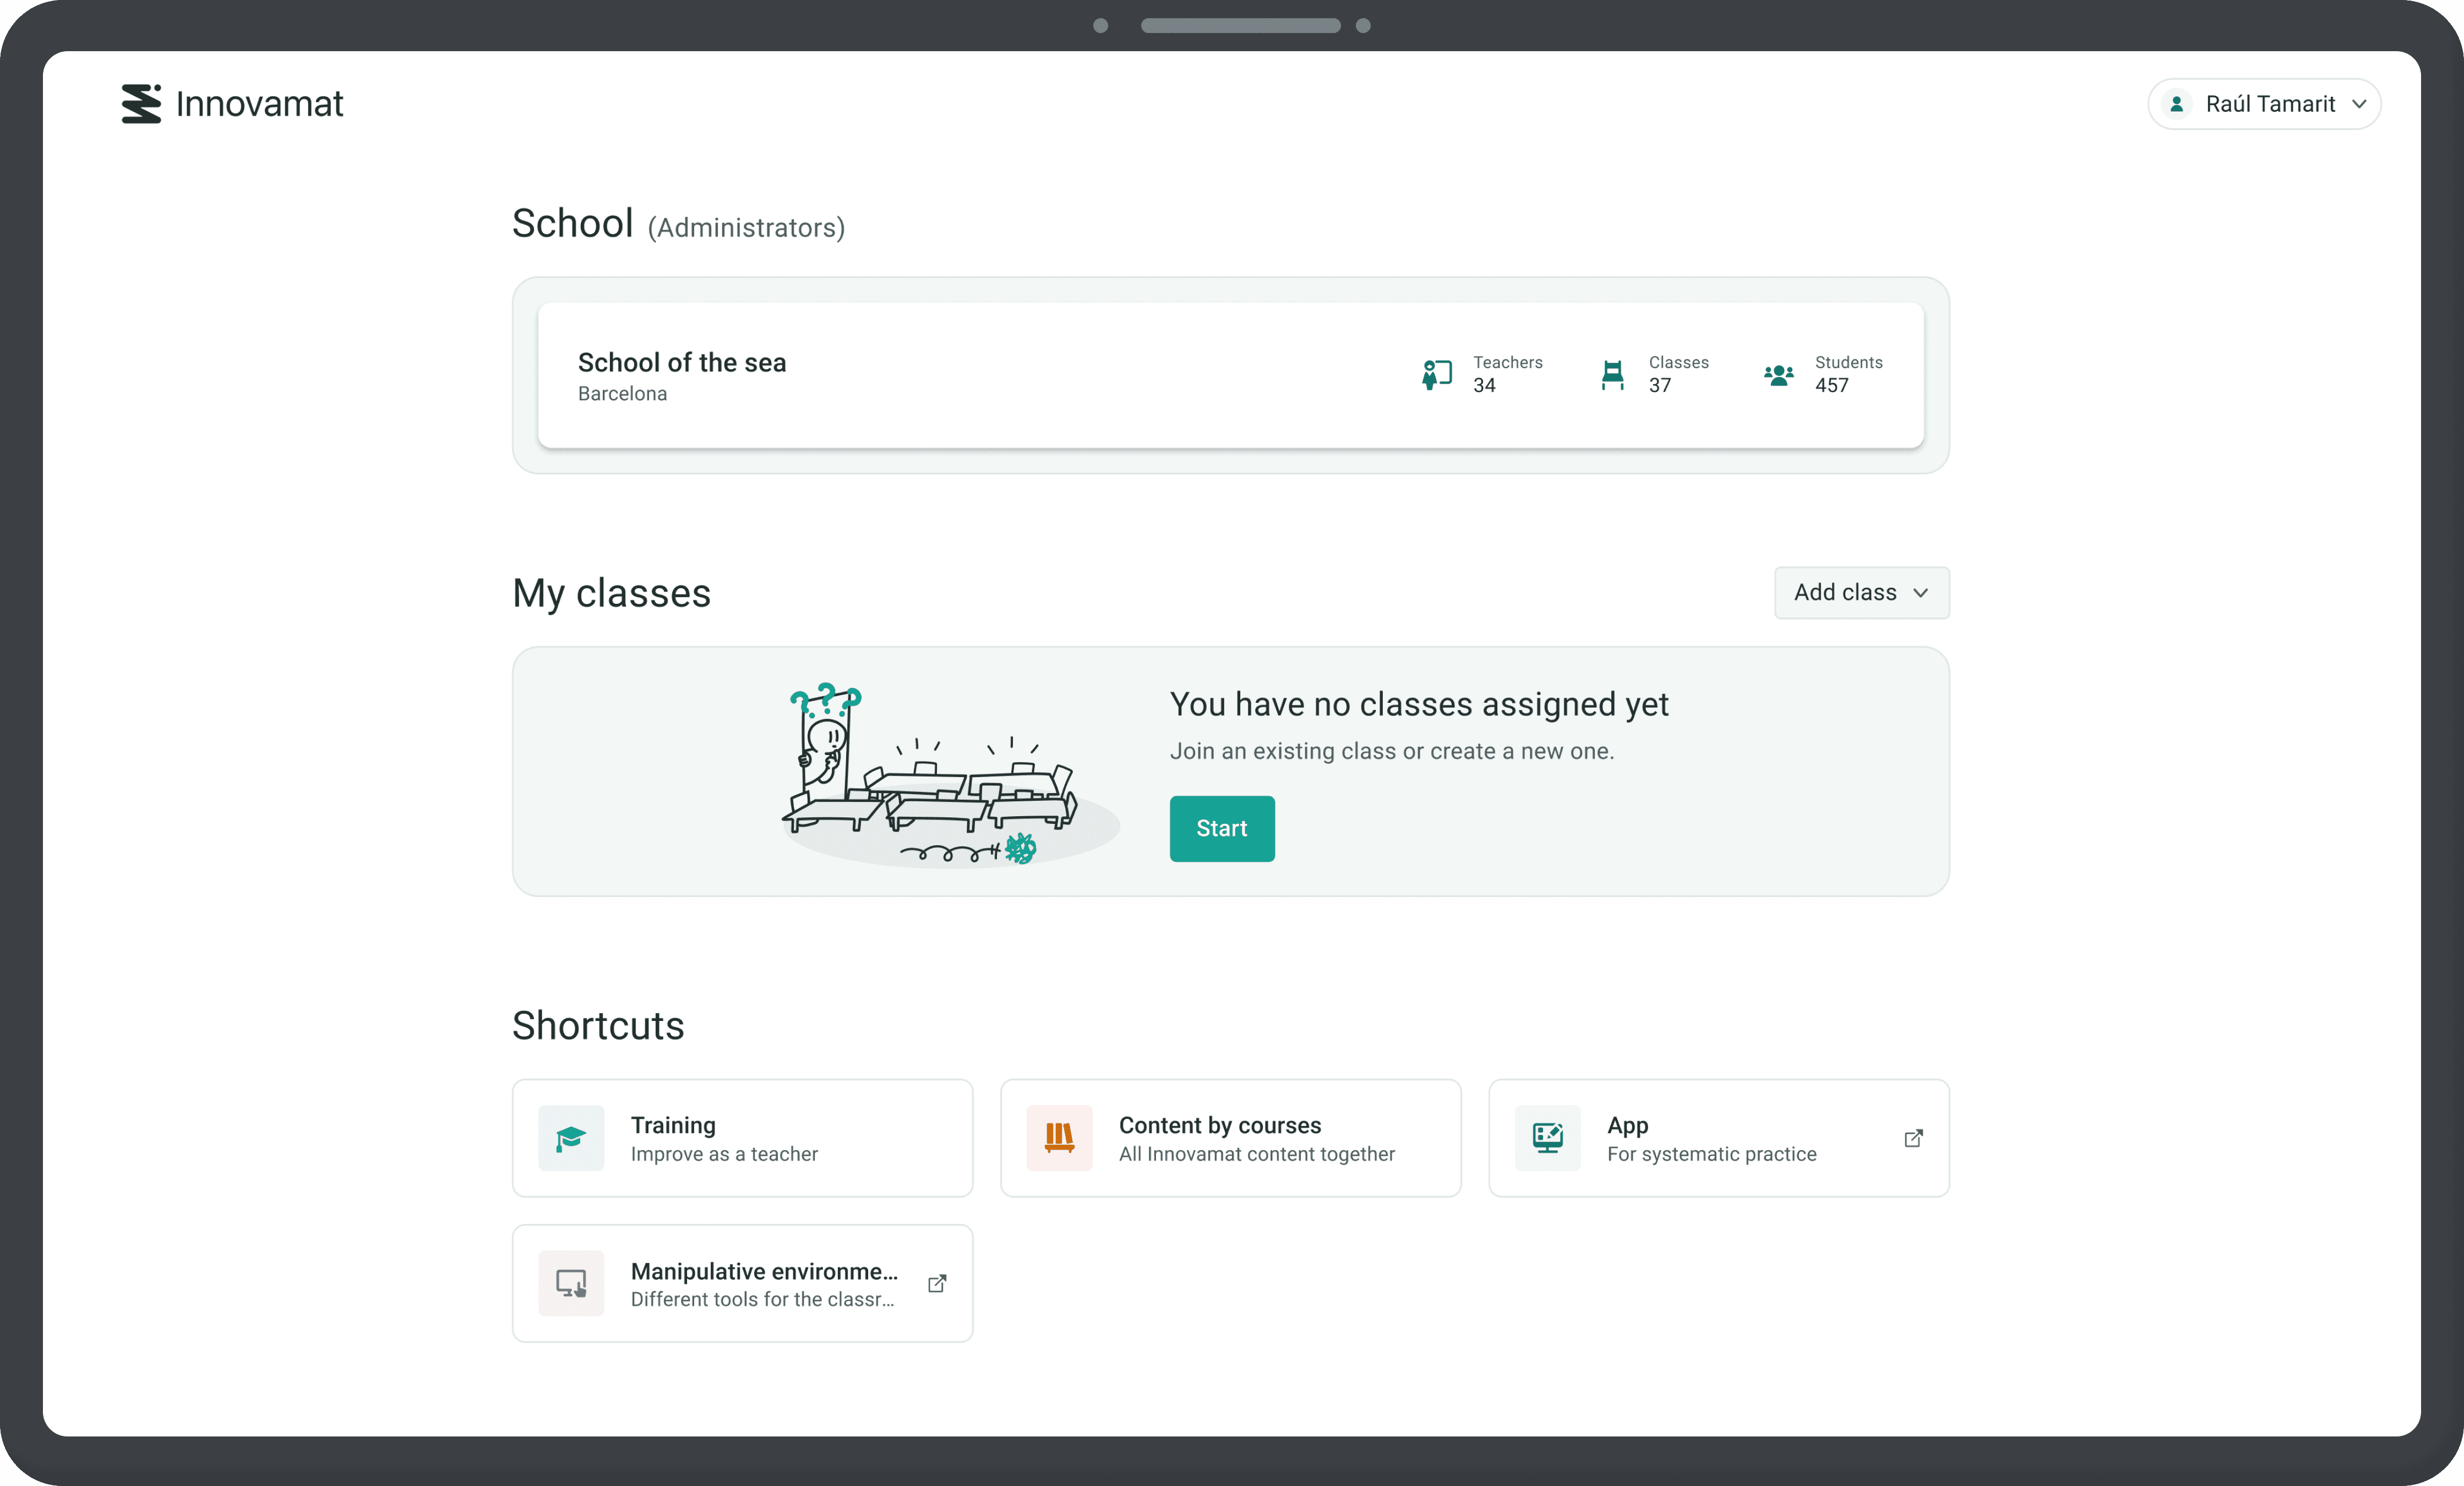
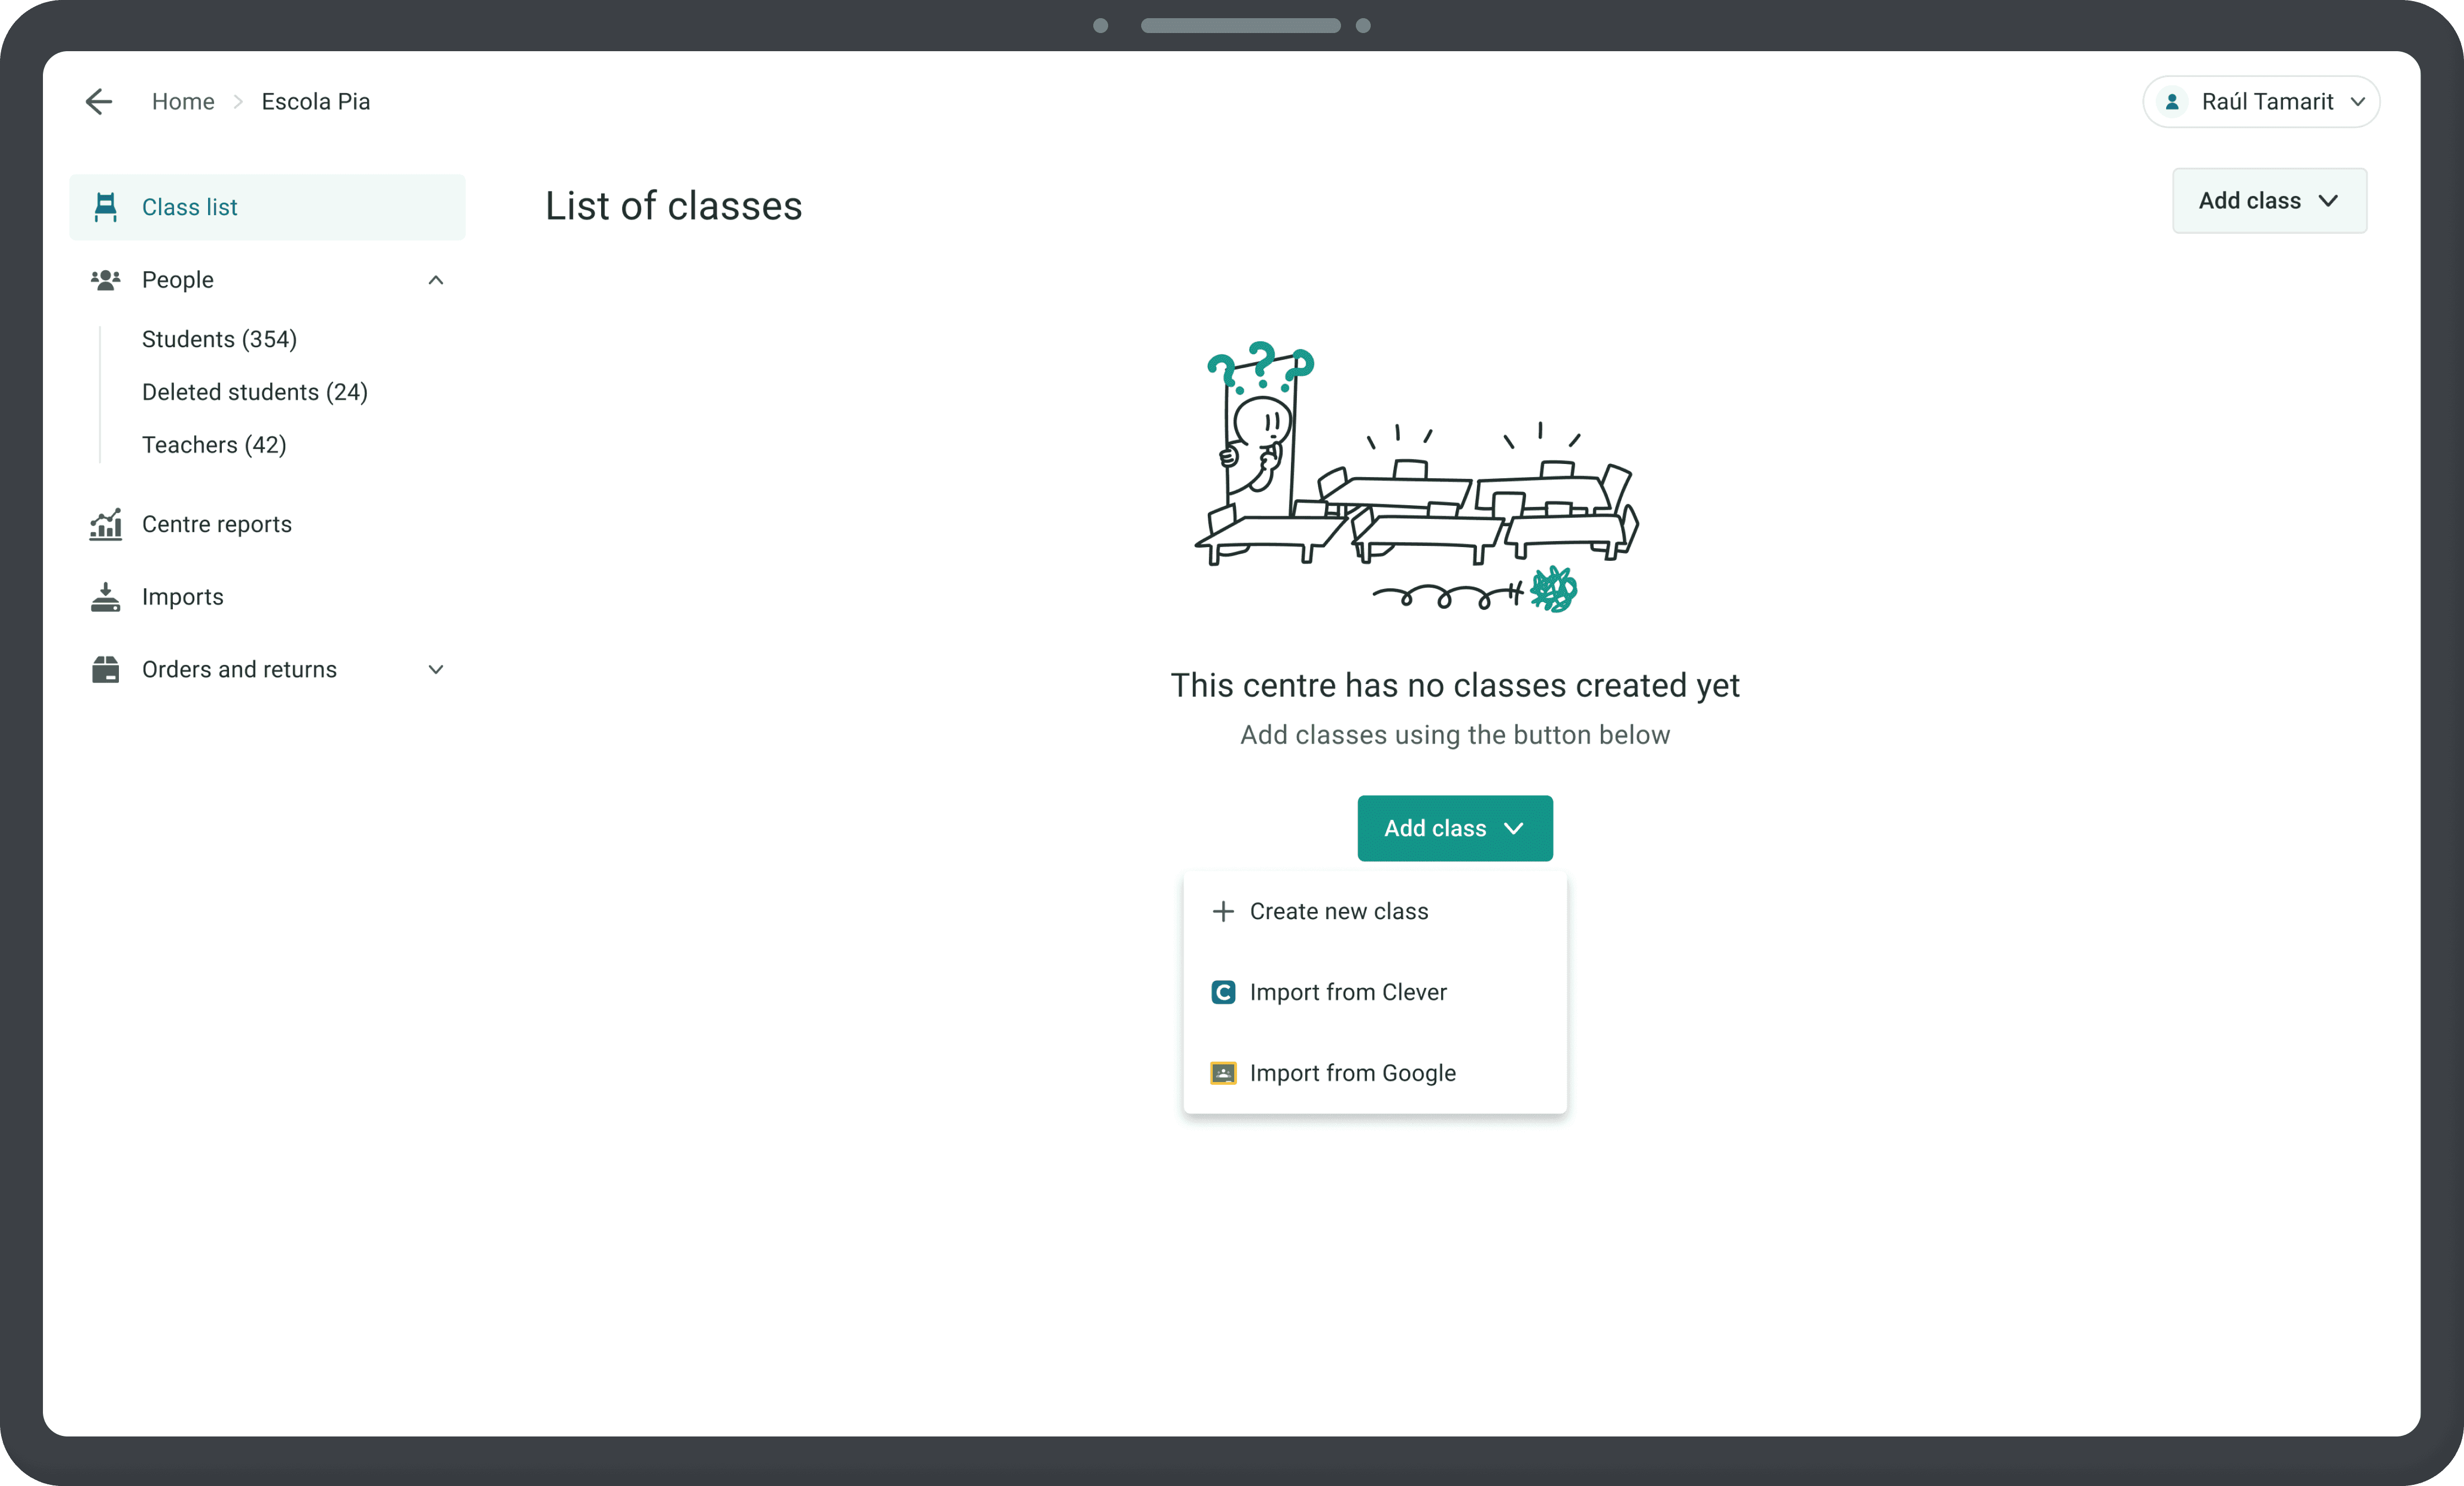
Empty states
We realised the "power" empty state had to help improve the user activation process.
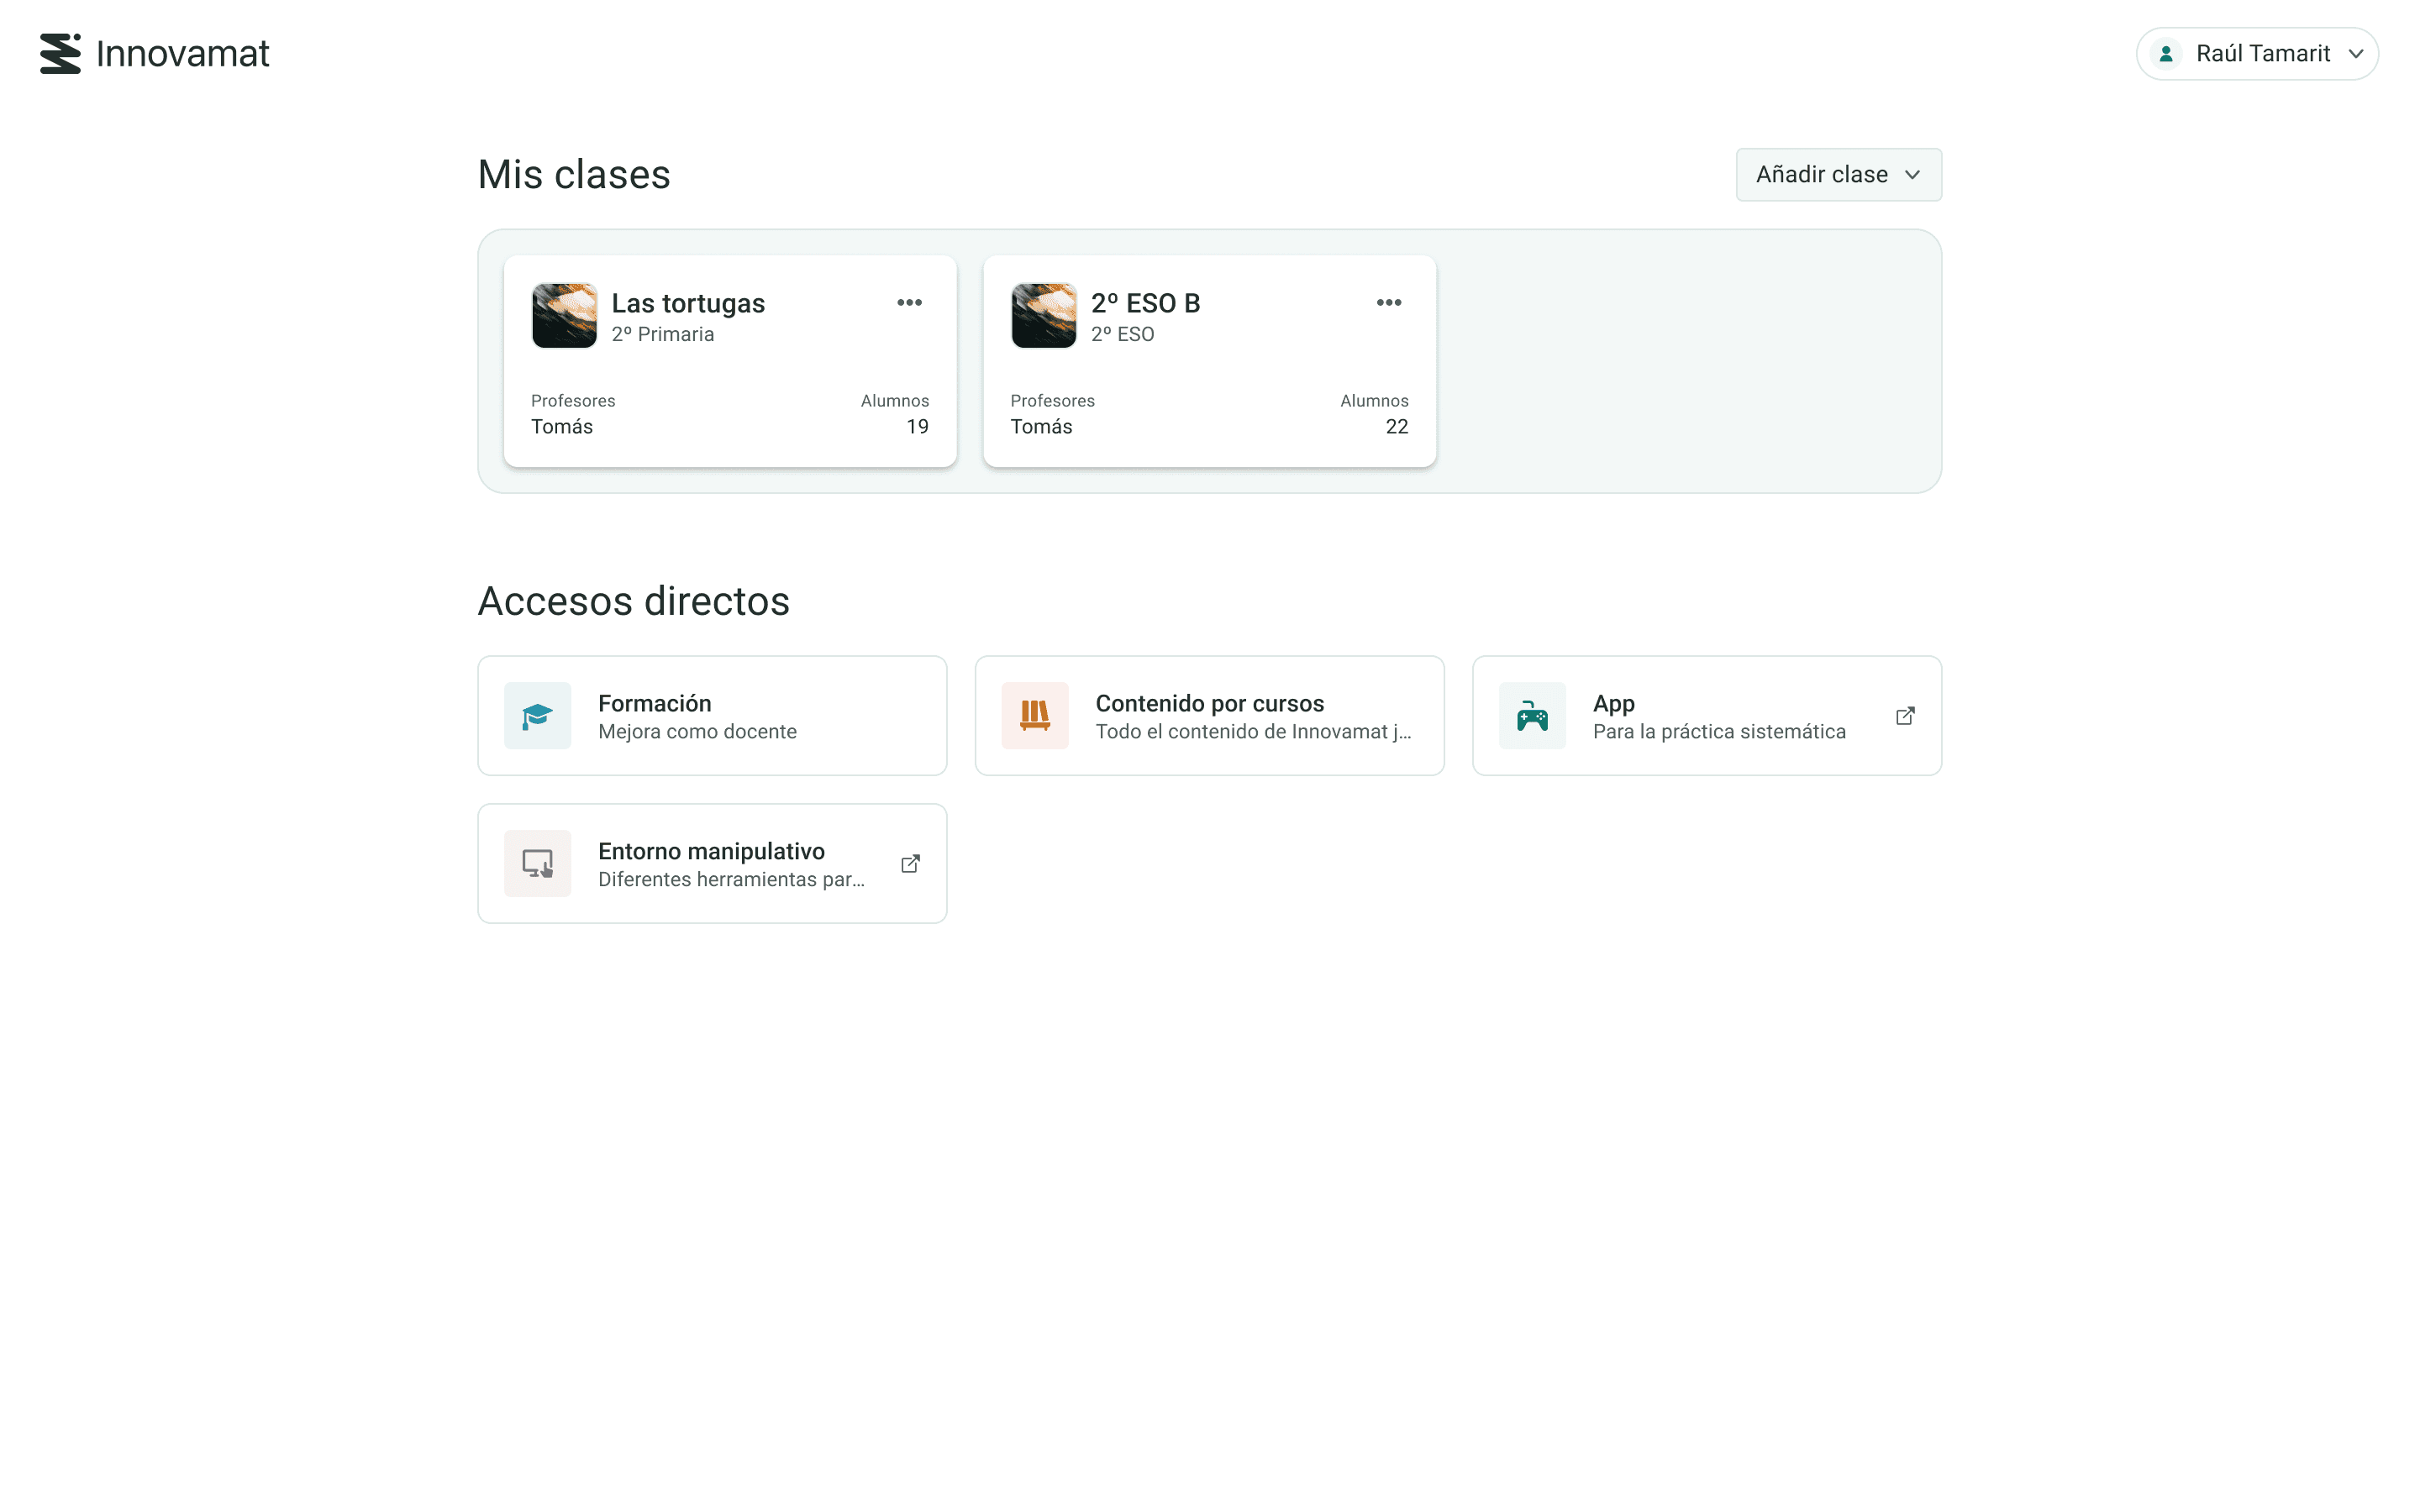
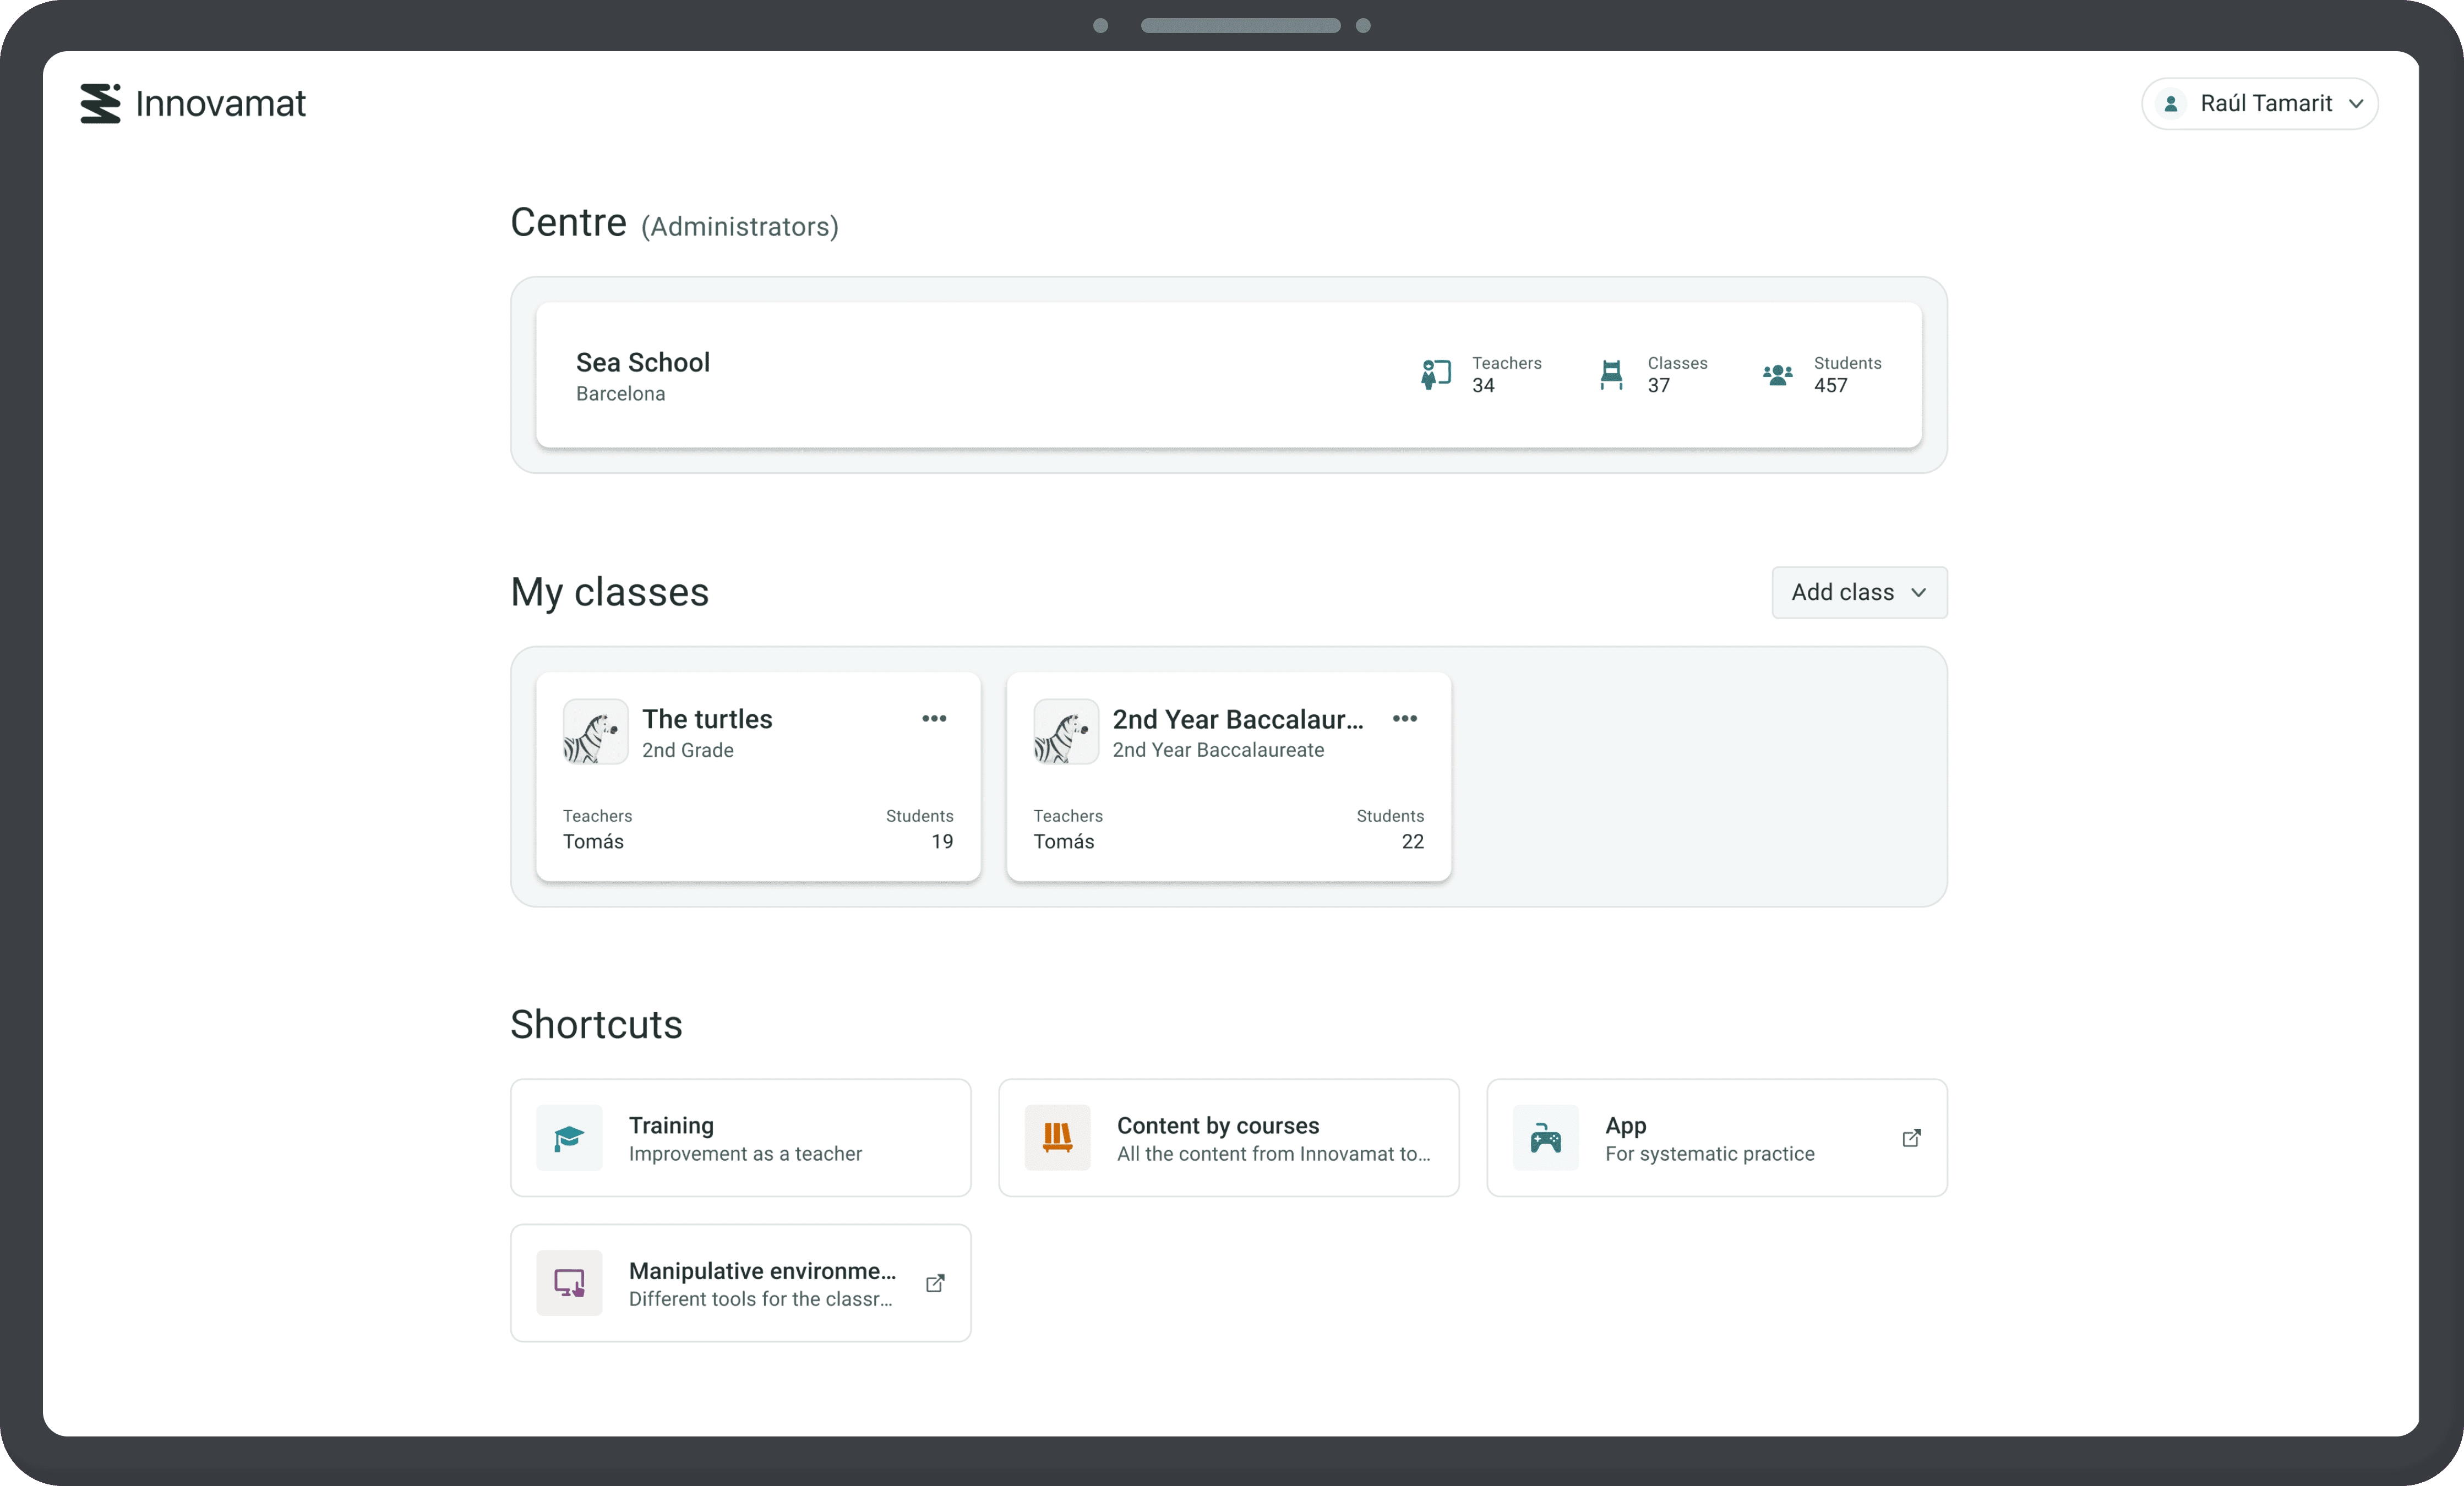
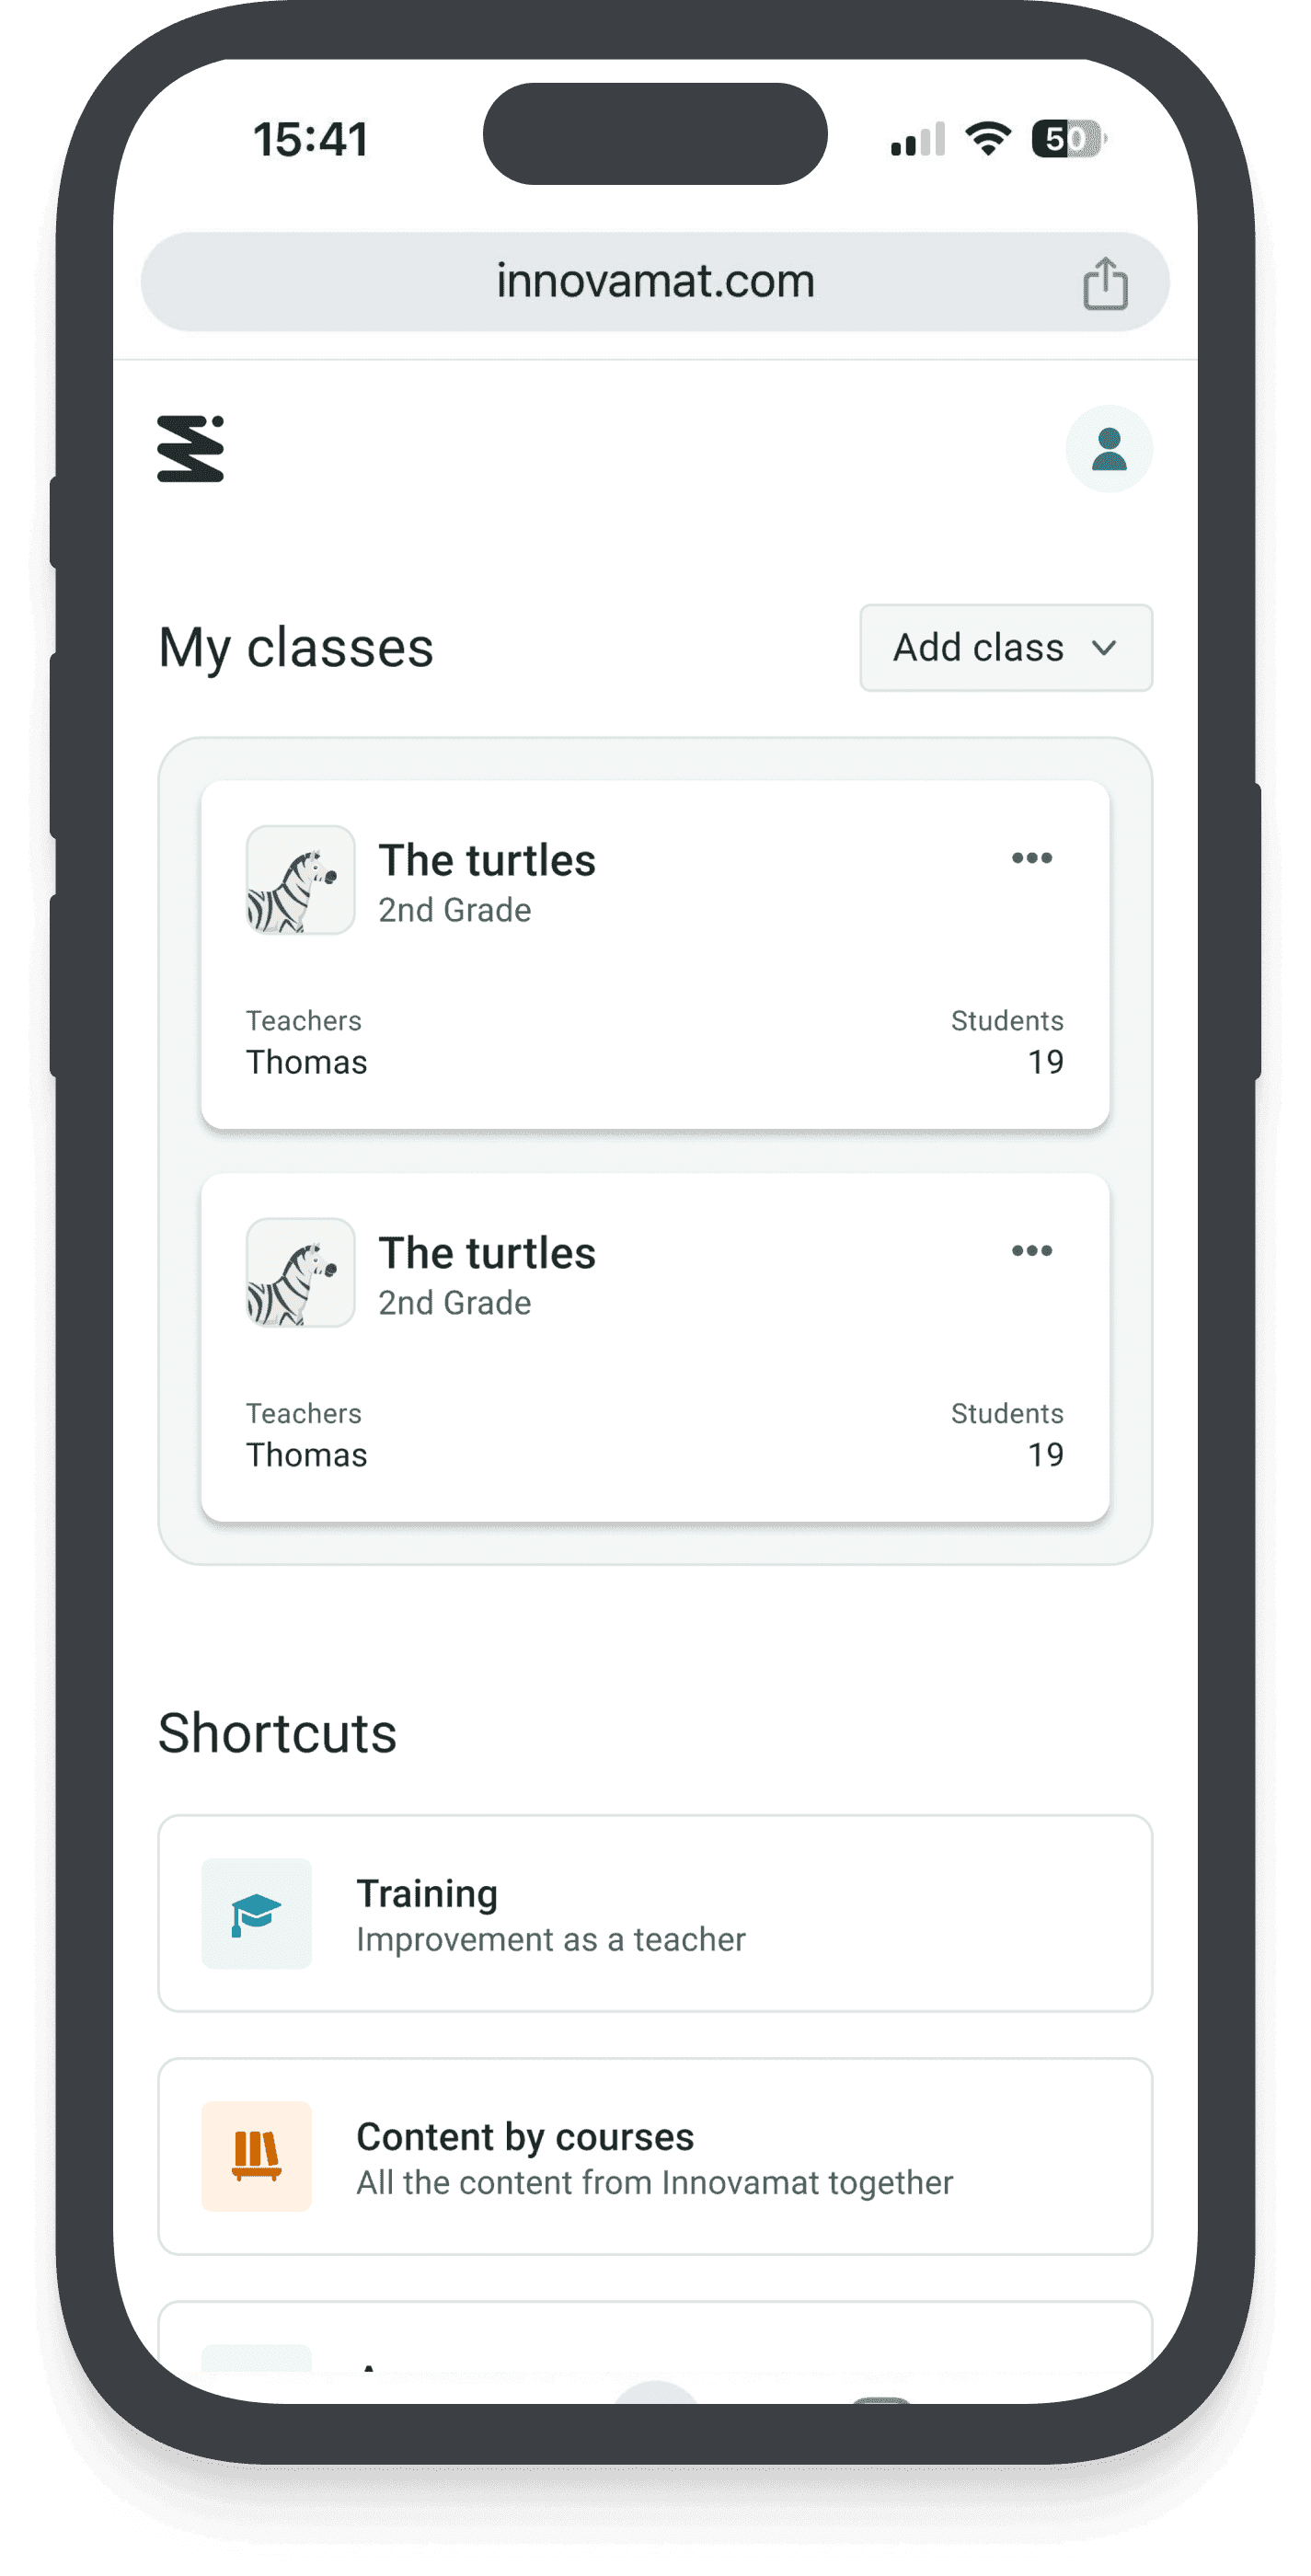
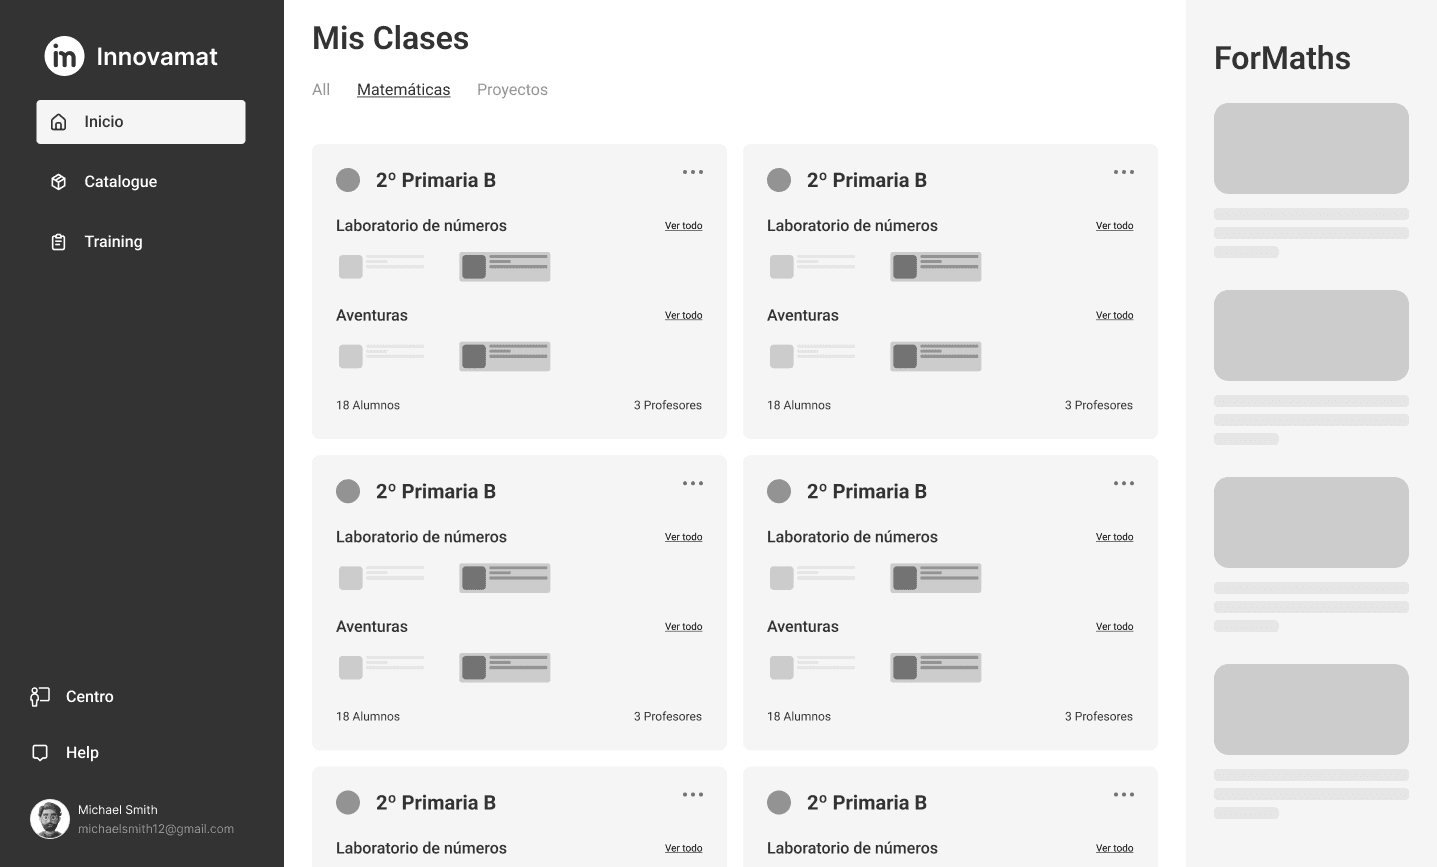
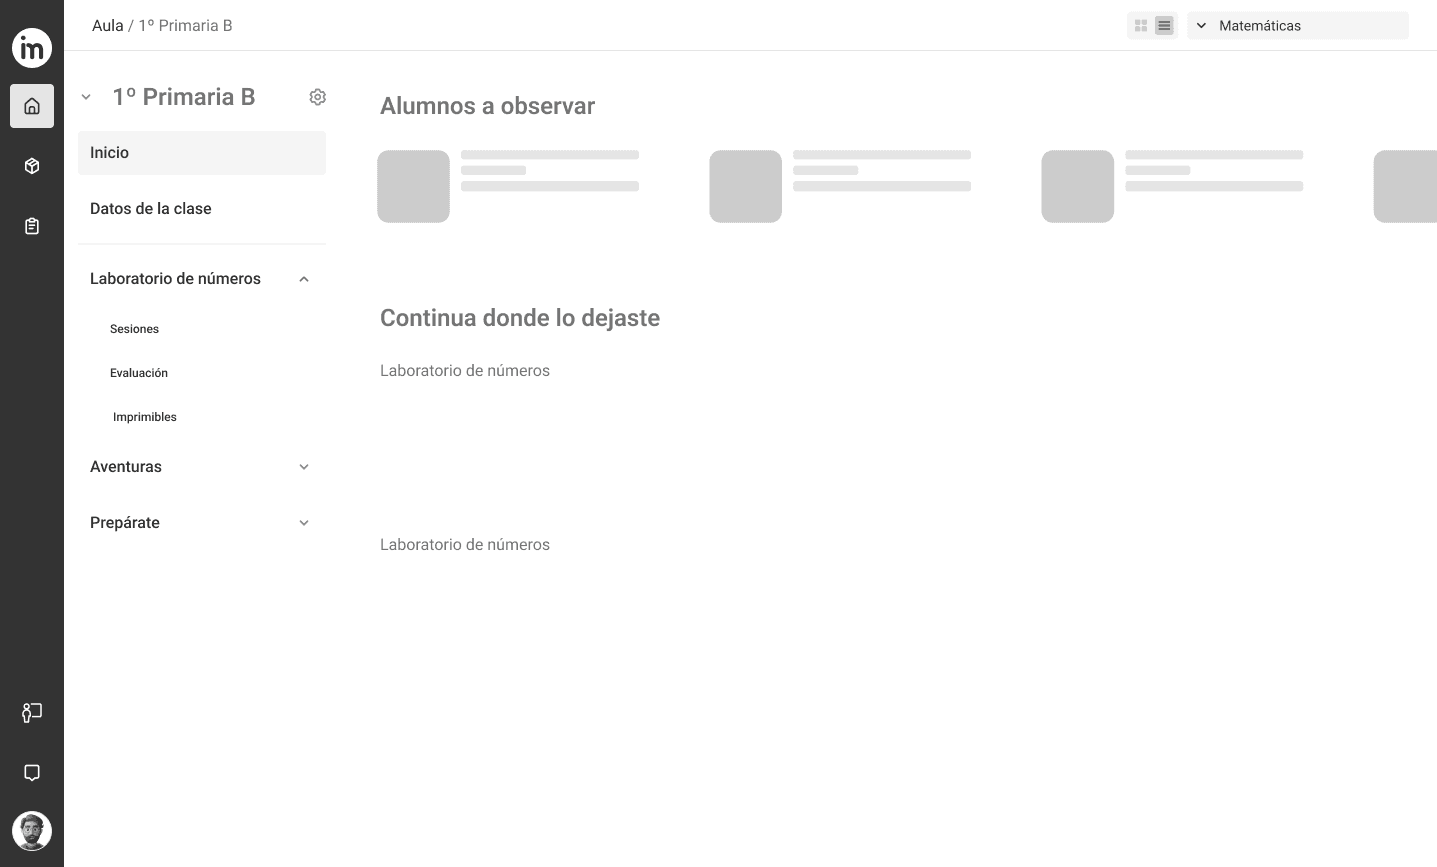
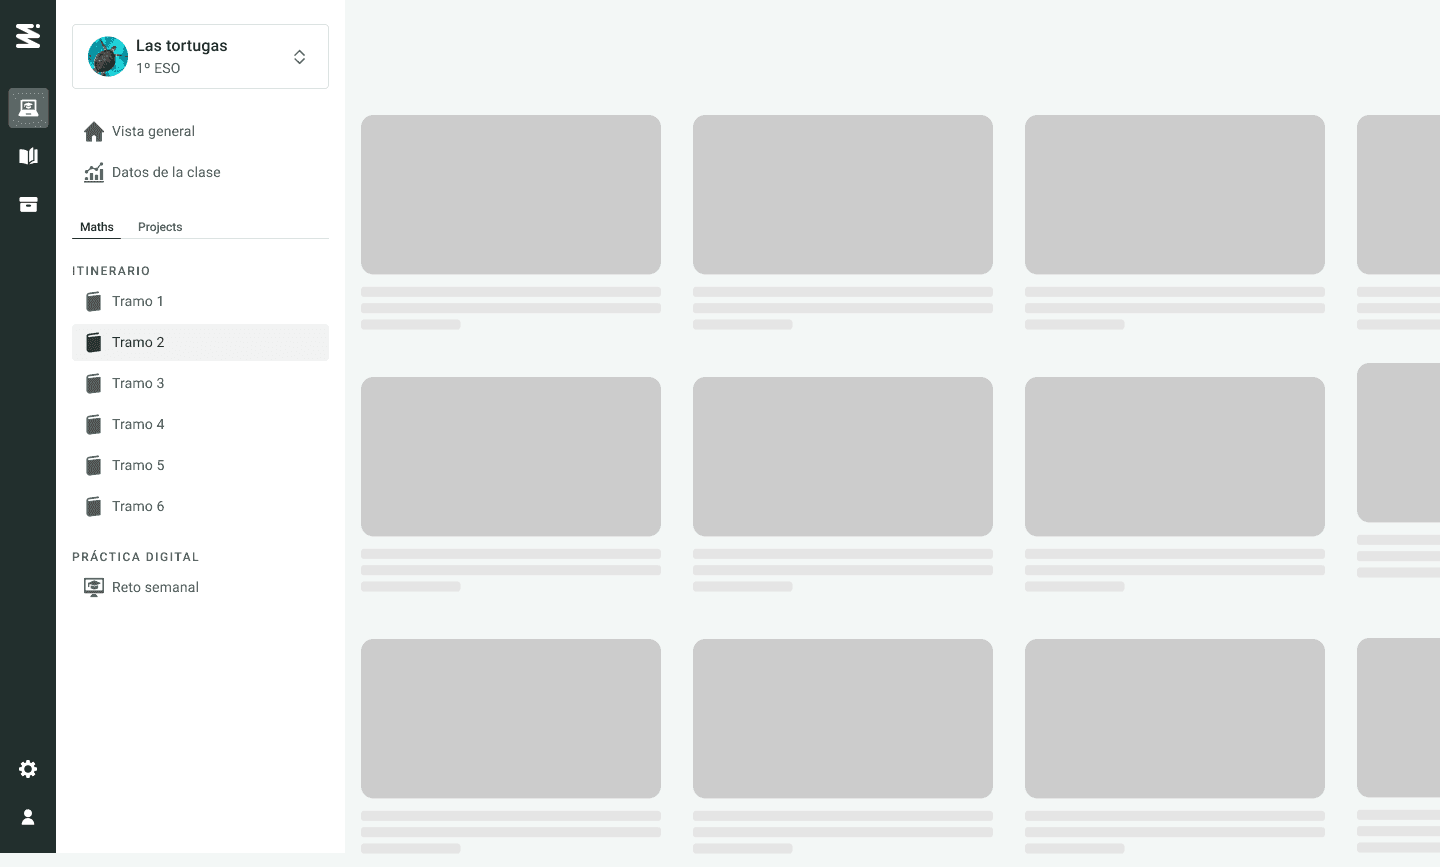
Designs
Impact measurement
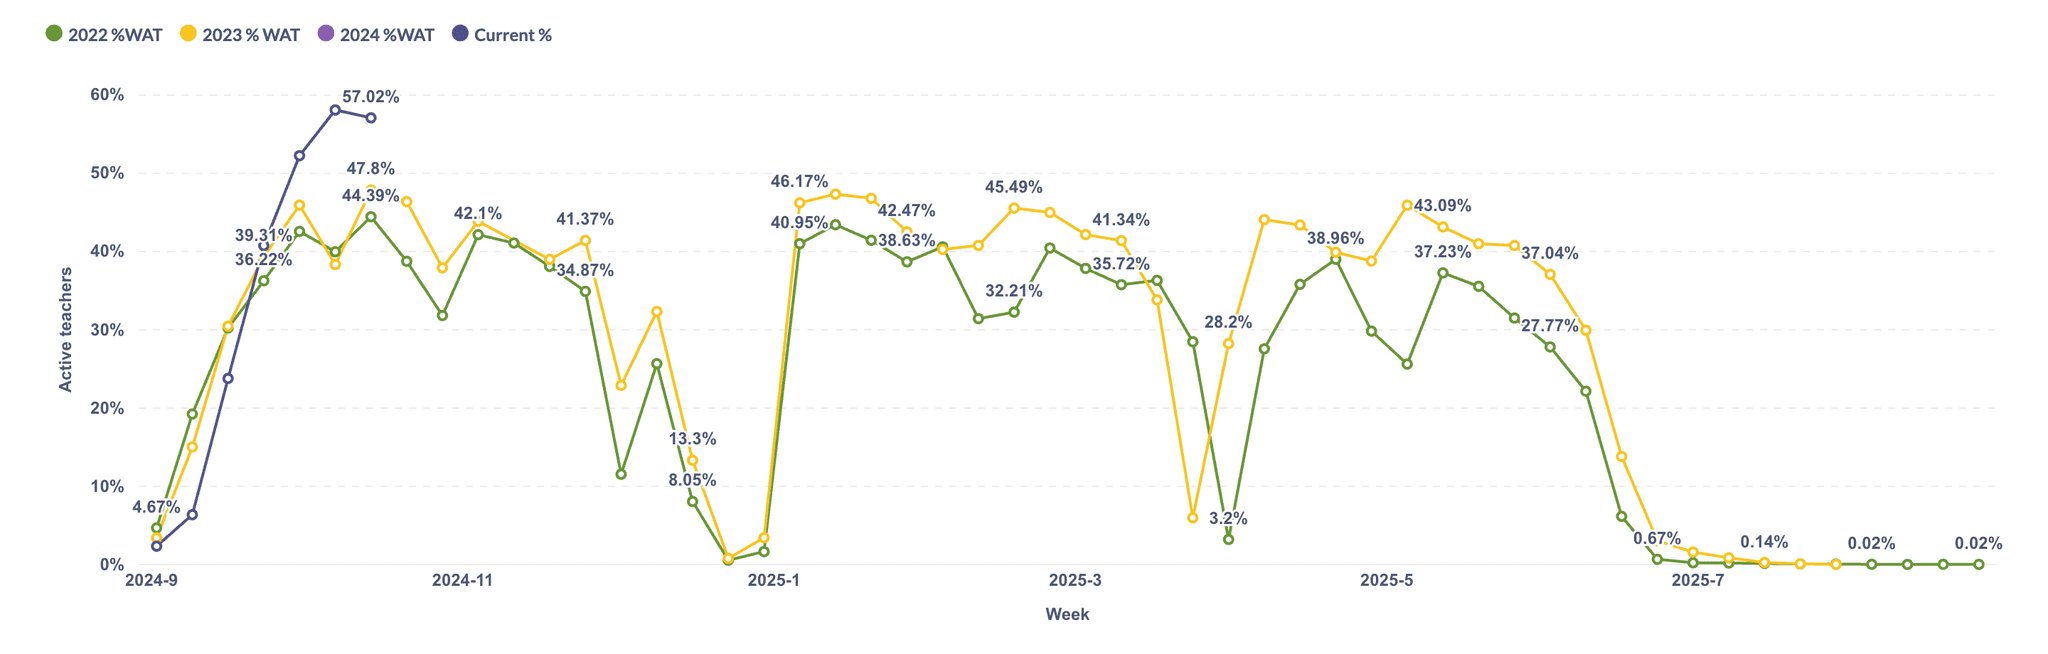
10%
more active teachers
Weekly active teachers in comparison to last academic year.
19%
Time reduction
From 21 s to 17.13 s median time to reach a desired resource.
5.2%
Less tickets
Coming from the help center regarding the classroom manager.
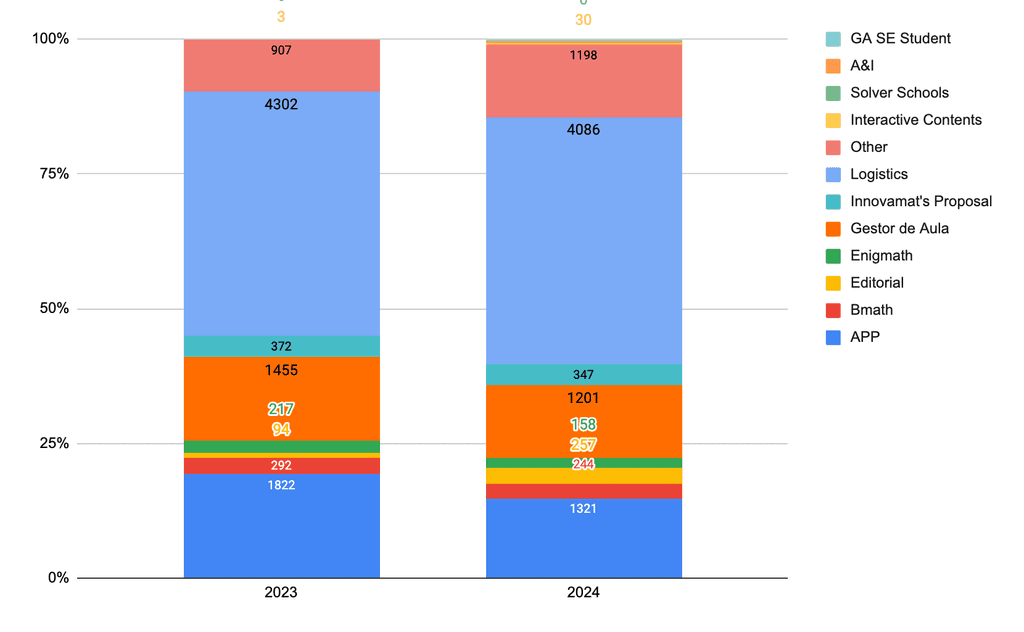
Weekly active teachers evolution
Volume of tickets by category